AUTHOR OF THIS BLOG

DR ANTHONY MELVIN CRASTO, WORLDDRUGTRACKER

3-BUTYL PYRIDINE, A simple nmr example

 Uncategorized  Comments Off on 3-BUTYL PYRIDINE, A simple nmr example
Jul 272014


3 Butyl pyridine

Formula: C9H13N, 135.2062

IR 

IR spectrum

IH NMR


NMR spectrum

SEE

http://www.sigmaaldrich.com/spectra/fnmr/FNMR006274.PDF


 Unsaturation answer

C9H13N
Rule 3, omit the N and one H, gives C9H12
9 – 12/2 + 1 = 4 degrees of unsaturation.
Look for an aromatic ring.

IR interpretation

The bands at 3000-2850 indicate C-H alkane stretches. The band at 3028 indicates C-H aromatic stretch; aromatics also show bands in the regions 1600-1585 and 1500-1400 (C-C in-ring stretch), and 900-675 (C-H out-of-plane). The bands in the region 1250-1020 could be due to C-N stretch. The weak, broad banc at about 3500 could be amine N-H stretch or it could be a slight contamination of an impurity (water) in the sample.

 Structure answer

Structure answer
This is the structure. See if you can assign the peaks on your own.

NMR structure interpretation

NMR answer


Share

ETHYL PROPIONATE NMR, carbonyl is dad and oxygen mom, a methyl gets more attention

 Uncategorized  Comments Off on ETHYL PROPIONATE NMR, carbonyl is dad and oxygen mom, a methyl gets more attention
Jul 242014
 

Dedicated to all moms

C=O group is dad


O atom is mom


Carbonyl is dad and oxygen mom hence c labelled methyl has higher chemical shift  and gets a little more attention

SEE BELOW

NMR IS EASY

A chemical has Formula: C5H10O2

C5H10O2
Rule 2, omit O, gives C5H10
5 – 10/2 + 1 = 1 degree of unsaturation.
Look for 1 pi bond or aliphatic ring.

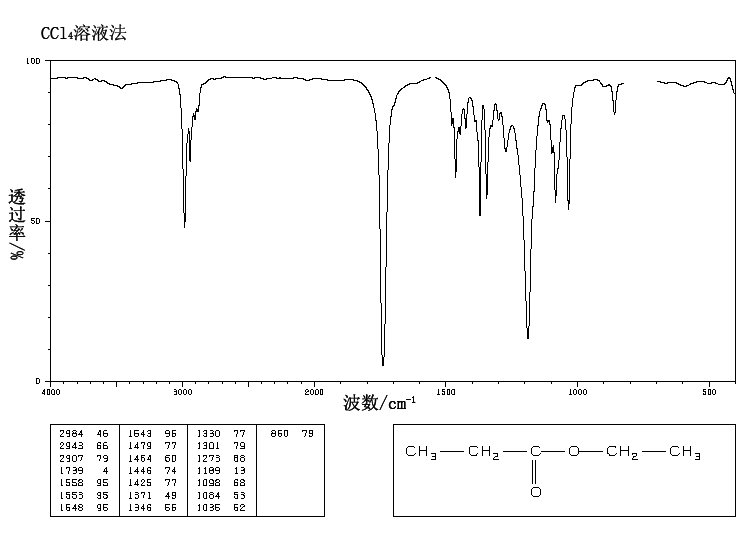
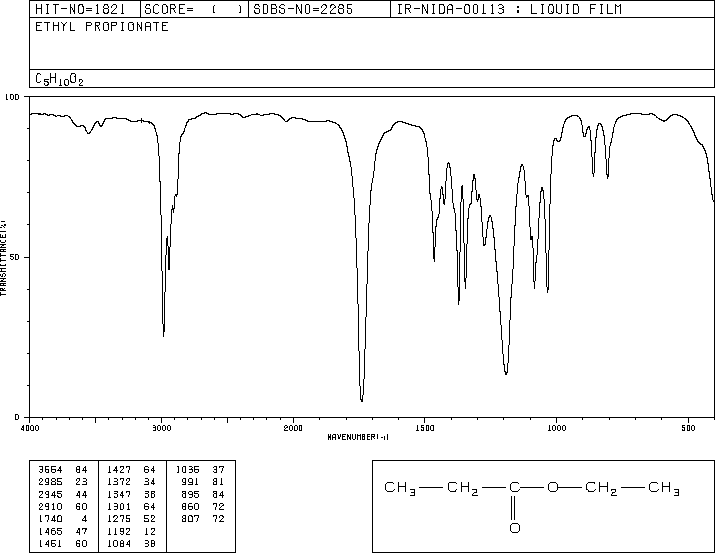
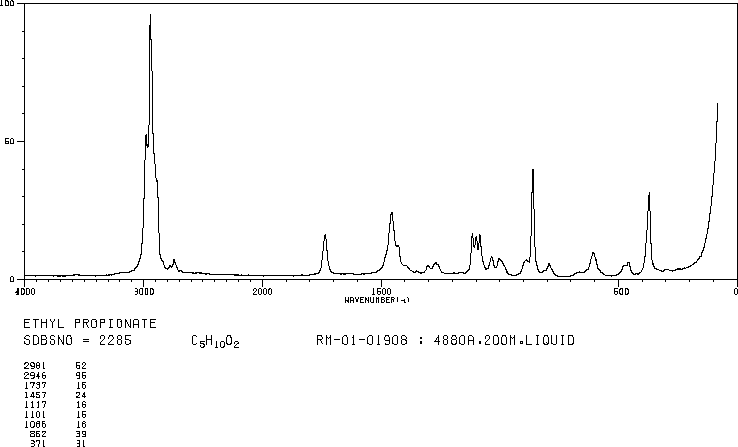
IR

IR spectrum


The band at 1740 indicates a carbonyl, probably a saturated aliphatic ester. The bands at 3000-2850 indicate C-H alkane stretches. The bands in the region 1320-1000 could be due to C-O stretch, consistent with an ester.


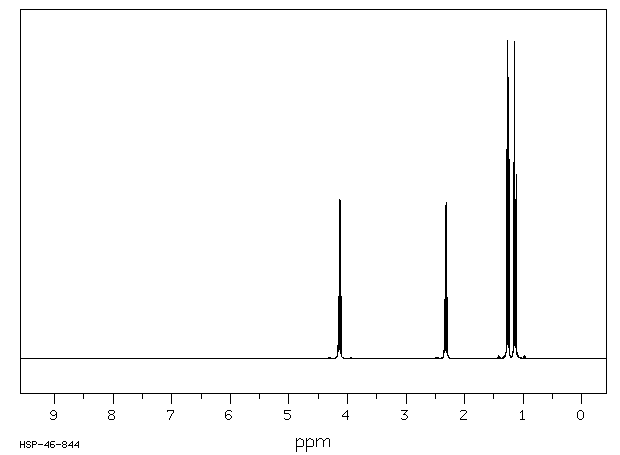
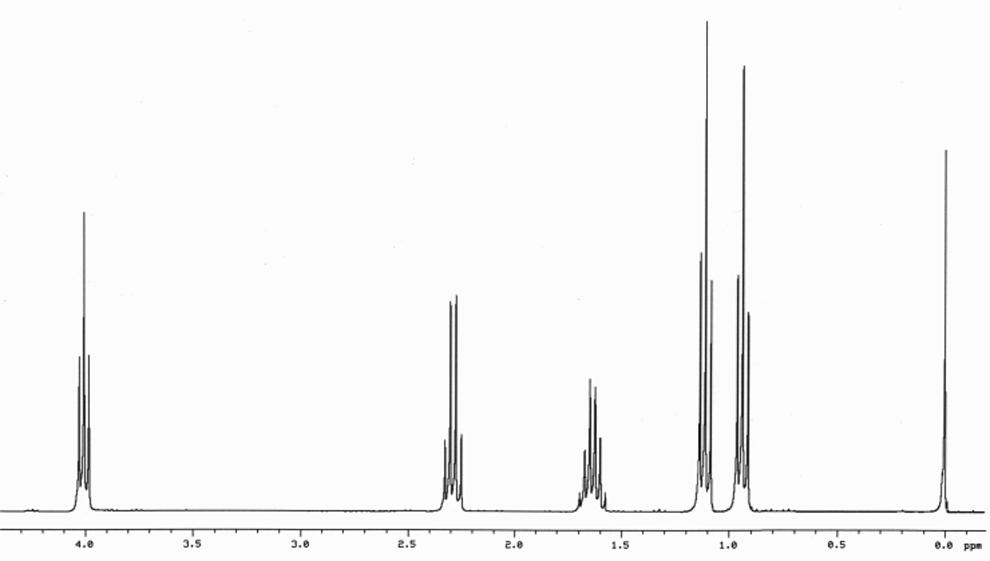
NMR spectrum

 Structure answer

Structure answerThis is the structure. See if you can assign the peaks on your own.

NMR answer

NMR answerC has a higher chemical shift than D because it’s closer to a more electron-withdrawing functional group.

Carbonyl is dad and oxygen mom,  hence c has higher chemical shift  and gets a little more attention in proton nmr

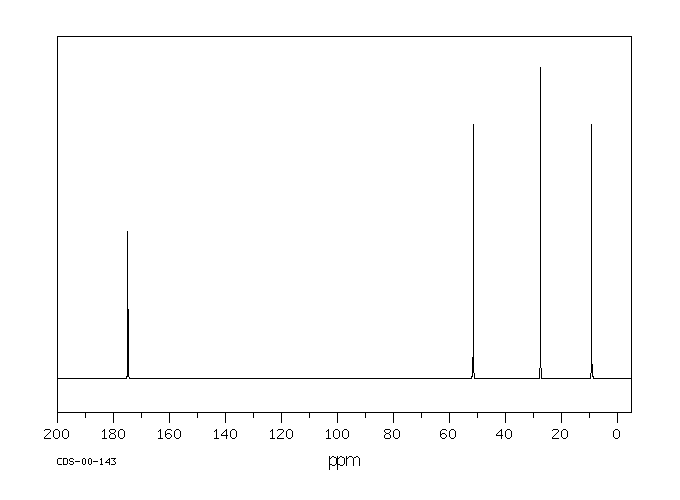
13 C NMR

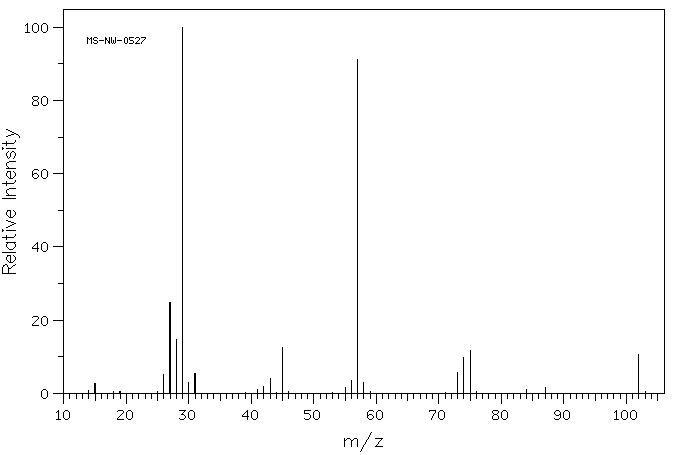
Mass spectrum


RAMAN


WHAT HAPPENS WHEN A CHLORO IS INTRODUCED


WHEN THERE IS ONE METHYL


WHEN THERE ONE CH2 SHORT 


WHEN MOM HAS ONE MORE CH2

PROPYL PROPIONATE, try this on your own

Propyl propanoate.png

1H NMR

image of Propyl proprionate


image of Propyl proprionate


13C NMR

image of Propyl proprionate


APT

image of Propyl proprionate


COSY

image of Propyl proprionate

WILL PASTE INTERPRETATION AFTER ONE WEEK……………….


Share

Integration in NMR

 Uncategorized  Comments Off on Integration in NMR
Jul 232014


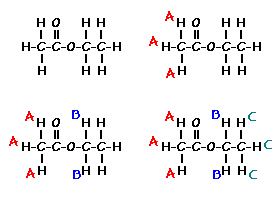
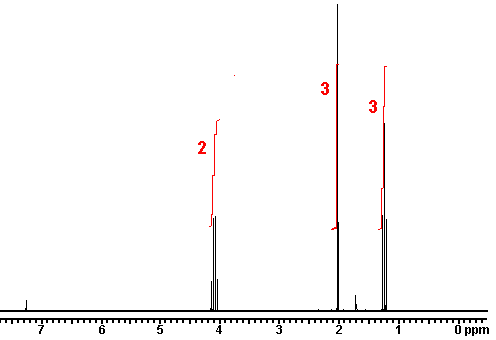
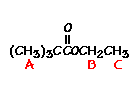
Place your arrow on above structure of Ethyl acetate………………It will flash

see label A,B,C

Integration in NMR

The intensity of the signal is proportional to the number of hydrogens that make the signal. Sometimes, NMR machines display signal intensity as an automatic display above the regular spectrum. (The exact number of hydrogens giving rise to each signal is sometimes also explicitly written above each peak, making our job a lot easier.) The intensity of the signal allows us to conclude that the more hydrogens there are in the same chemical environment, the more intense the signal will be.

Introduction

We can get the following information from a 1H Nuclear Magnetic Resonance (NMR) structure:

  1. The number of signals gives the number of non-equivalent hydrogens
  2. Chemical shifts show differences in the hydrogens’ chemical environments
  3. Splitting presents the number of neighboring hydrogens (N+1 rule)
  4. Integration gives the relative number of hydrogens present at each signal

The integrated intensity of a signal in a 1H NMR spectrum (does not apply to 13C NMR) gives a ratio for the number of hydrogens that give rise to the signal, thereby helping calculate the total number of hydrogens present in a sample.NMR machines can be used to measure signal intensity, a plot of which is sometimes automatically displayed above the regular spectrum. To show these integrations, a recorder pen marks a vertical line with a length that is proportional to the integrated area under a signal (sometimes referred to as a peak)– a value that is proportional to the number of hydrogens that are accountable for the signal. The pen then moves horizontally until another signal is reached, at which point, another vertical marking is made. We can manually measure the lengths by which the horizontal line is displaced at each peak to attain a ratio of hydrogens from the various signals. We can use this technique to figure out the hydrogen ratio when the number of hydrogens responsible for each signal is not written directly above the peak (look in the links section for an animation on how to manually find the ratio of hydrogens as described here).


Now that we’ve seen how the signal intensity is directly proportionate to the number of hydrogens that give rise to that signal, it makes sense to conclude that the more hydrogens of one kind there are in a molecule (equivalent hydrogens, so in the same chemical environment), the more intense the corresponding NMR signal will be. Here’s above  a model that may help clear up some of the uncertainties. 

Problems

1.) True or False? The number of hydrogens determines the intensity of a signal.


ans…………False. The relative number of hydrogens determines the intensity of a signal. The signal given by the three hydrogens in CH3CH2CHCl2 will not have the same intensity as the three hydrogens in ClCH2OCH3.

2.) Give the number of signals, the chemical shift value for each signal, and the number of integrating hydrogens for   CH3OCH2CH2OCH3

answer There are 2 signals. One is at 3.3 ppm (6 hydrogens); the other at 3.5 ppm (4 hydrogens).

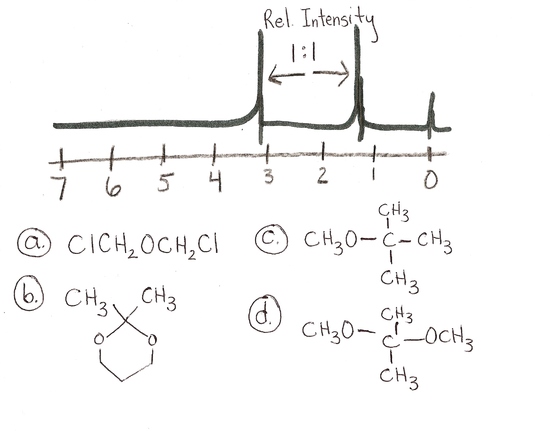
3


4.) scan0002.jpganswer is a and d

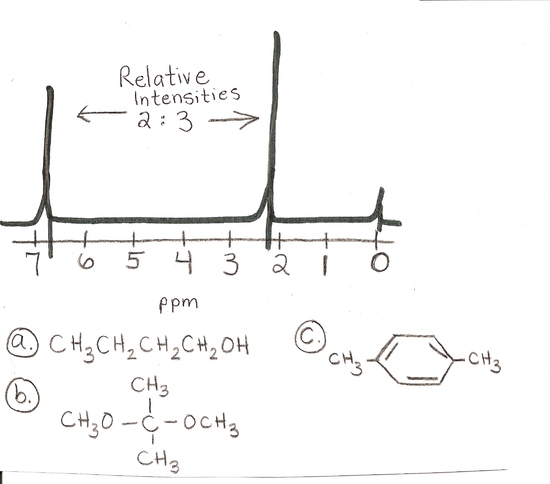
 scan0004.jpg

answer is c

Answers

  1. False. The relative number of hydrogens determines the intensity of a signal. The signal given by the three hydrogens in CH3CH2CHCl2 will not have the same intensity as the three hydrogens in ClCH2OCH3.
  2. There are 2 signals. One is at 3.3 ppm (6 hydrogens); the other at 3.5 ppm (4 hydrogens).
  3. a and d
  4. c

Number of Different Hydrogens


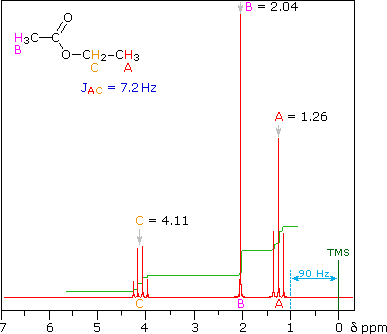
Ethyl acetate contains 8 hydrogens and some of them are different from each other. 

For example, those labeled A are attached to a carbon bonded to a carbonyl group and are different from the hydrogens labeled which are bonded to a carbon attached to an oxygen atom.


You can check whether certain hydrogens are the same or equivalent by replacing each hydrogen with some group X and seeing if you generate the same compound. You should convince yourself that replacing each hydrogen labeled A by X gives you identical compounds which are all equivalent by a C-C bond rotation. If this is difficult to “see” look at this molecular model of ethyl acetate to see if you can convince yourself that all the hydrogens labeled A are the same.

Integration

The area under the NMR resonance is proportional to the number of hydrogens which that resonance represents. In this way, by measuring or integrating the different NMR resonances, information regarding the relative numbers of chemically distinct hydrogens can be found. Experimentally, the integrals will appear as a line over the NMR spectrum.Integration only gives information on the relative number of different hydrogens, not the absolute number. 


 Review Questions

For ethyl acetate,
What ratio would you expect to see for the integrals for the hydrogens labeled A:B:C?

3-2-3
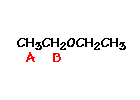
For ethyl ether,
What ratio would you expect to see for the integrals for the hydrogens labeled A:B?3-2
For t-butyl acetate,
What ratio would you expect to see for the integrals for the hydrogens labeled A:B:C?

6-2-3

ratio

2 3 3

or

4 6 6

Outside Links

References

  1. Schore, Neil E. and Vollhardt, K. Peter C. Organic Chemistry: Structure and Function. New York: Bleyer, Brennan, 2007. (405-407)
  2. UC Davis 118A Supplementary Booklet for the Laboratory/Discussion (Fall quarter 2008)_ Page 39


Share

1-PENTANAL NMR

 Uncategorized  Comments Off on 1-PENTANAL NMR
Jul 222014


Formula: C5H10O

C5H10O
Rule 2, omit O, gives C5H10
5 – 10/2 + 1 = 1 degree of unsaturation.
Look for 1 pi bond or aliphatic ring.

IR spectrum

The band at 1727 indicates a carbonyl, probably an aldehyde; an aldehyde is also suggested by the band at 2719 which is likely the C-H stretch of the H-C=O group. The bands at 3000-2850 indicate C-H alkane stretches.


NMR spectrum


Structure answern


NMR answer


Proton NMR Spectrum

Since the IR spectrum indicates an aldehyde, look for this functionality in the NMR spectrum. The aldehydic proton appears in the NMR from 9-10, usually as a small singlet.

The spectrum above shows a small singlet corresponding to one proton at 9.2 ppm, confirming that the compound is an aldehyde. Protons on the carbon adjacent to the aldehyde carbonyl will show up at 2-2.7 ppm; this is the triplet peak of 2 protons at 2.4 ppm on the above spectrum. Thus, so far we know that there is an aldehyde group next to a methylene group which is next to a carbon that has two hydrogens:

This accounts for 3 of the 5 carbons in the molecule. The un-colored hydrogens in the above structure could correspond to the peak of 2 hydrogens centered at 1.6 ppm; this peak is a pentet indicating that these protons are adjacent to carbons with a total of 4 hydrogens. The peak centered at 1.35 ppm has two hydrogens and is a sextet, indicating it is next to carbons that have a total of 5 hydrogens. Finally, the peak at 0.9 ppm has 3 hydrogens and is a triplet, indicating it is a methyl group adjacent to a carbon that has 2 hydrogens. Therefore, it looks like the molecule is a straight-chain of 5 carbons with the aldehyde group at one end:

Note that the closer a group is to the carbonyl function, the further downfield it is shifted. Here is how the NMR correlates to the structure:

MASS SPECTRUM

Share

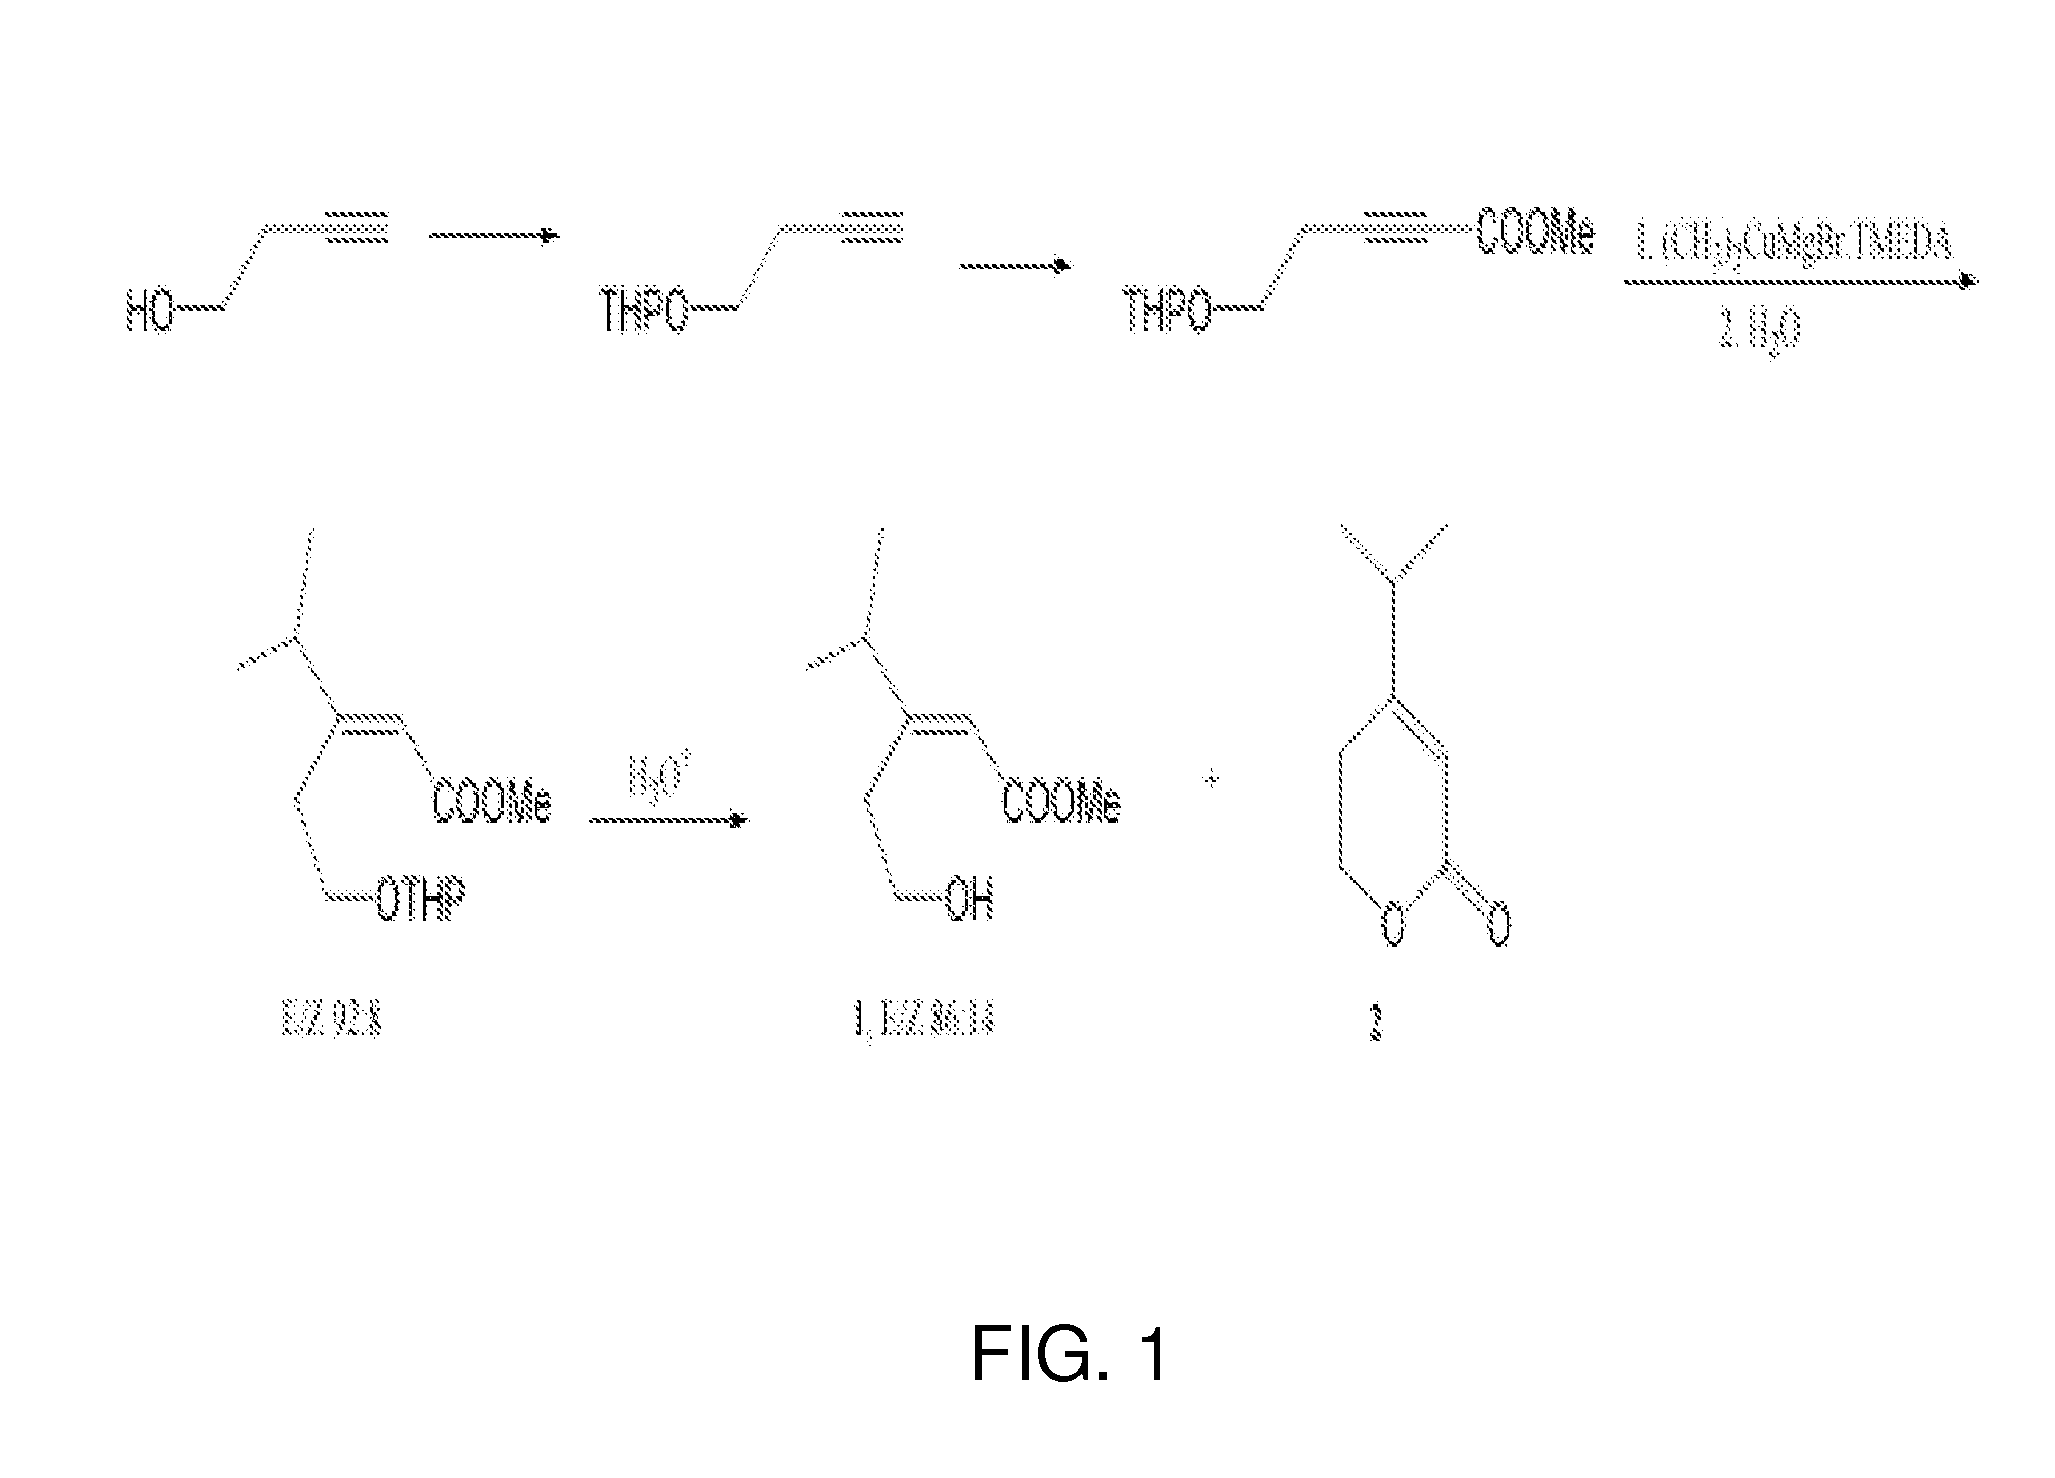
Identification and synthesis of a male-produced pheromone for the neotropical root weevil diaperpes abbreviatus (coleoptera: curculionidae) US 20130189222 A1

 Uncategorized  Comments Off on Identification and synthesis of a male-produced pheromone for the neotropical root weevil diaperpes abbreviatus (coleoptera: curculionidae) US 20130189222 A1
Jul 202014
 

1= methyl (E)-3-(2-hydroxyethyl)-4-methyl-2-pentenoate+methyl (E)-3-(2-hydroxyethyl)-4-methyl-2-pentenoate

2=

http://www.google.com/patents/US20130189222?cl=en

an unsaturated hydroxy ester pheromone collected from the headspace and feces of male Diaprepes abbreviatus was isolated, identified and synthesized. The pheromone, methyl (E)-3-(2-hydroxyethyl)-4-methyl-2-pentenoate, was discovered by gas chromatography-coupled electroantennogram detection (GC-EAD) and identified by gas chromatography-mass spectrometry (GC-MS) and nuclear magnetic resonance spectroscopy (NMR). The synthetic protocol yielded a 86:14 mixture of methyl (E)-3-(2-hydroxyethyl)-4-methyl-2-pentenoate and an inactive methyl (Z)-3-(2-hydroxyethyl)-4-methyl-2-pentenoate along with a lactone decomposition product. The activity of the synthetic E isomer was confirmed by GC-EAD, GC-MS, NMR and behavioral assays. No antennal response was observed to the Z isomer or the lactone. In a two-choice olfactometer bioassay, female D. abbreviatus moved upwind towards the synthetic pheromone or a source of natural pheromone more often as compared to clean air. Males showed no clear preference for the synthetic pheromone.


The root weevil Diaprepes abbreviatus (L.), is a major pest of citrus in the Caribbean and Florida. Prior to the 1960’s, D. abbreviatus was reported only in the Caribbean. Because multiple phenotypic populations occur on Puerto Rico it is suggested that D. abbreviatus originated in Puerto Rico (Lapointe 2004). Since its discovery near Apopka, Fla. in 1964, it has spread to Louisiana, Texas and California. There is no geographic or climatic barrier to prevent the southern movement of this insect to Mexico, Mesoamerica and South America (Lapointe et al. 2007).

This migration is of concern because this insect is destructive. Adult beetles of D. abbreviatus oviposit and feed on leaves of a wide range of hosts including more than 270 species of plants in 59 plant families. Feeding by adults on leaves causes a characteristic notching pattern; however, the larval stage causes the most serious damage. Neonate larvae fall to the ground and burrow into the soil where they feed on progressively larger roots over a period of months as they grow. Larval feeding on citrus tree roots can eventually girdle the crown area of the root system, killing the host plant. When larval development is completed, adults emerge from the soil to feed upon foliage where aggregation, mating and oviposition take place. In certain citrus growing areas, root damage by larval D. abbreviatus creates favorable conditions for species ofPhytophthora, a very serious and often lethal plant pathogen, to invade roots and further hasten the decline of trees.

In Florida, citrus growers spend up to $400/acre for combined control of D. abbreviatus and Phytophthora. In 2009, it was estimated that the total increase in costs per ton due to the establishment and spread of Diaprepes root weevil in California would be $53.60 for orange, $45.20 for grapefruit, $42.50 for lemon and $200.00 for avocado. In view of the negative economic impact caused by the feeding of this insect and in view of the fact that there appear to be no natural barriers to important agricultural citrus growing areas, attractants that will allow for the monitoring, tracking, trapping and destroying of this insect have been sought.

Diaprepes abbreviatus has been placed in the subfamily Entiminae of the Curculionidae (Marvaldi et al. 2002) Within the superfamily Cu rculionoidea (weevils) the majority of attractants or pheromones identified to date are long-range, male-produced aggregation pheromones (Seybold and Vanderwel 2003, Ambrogi et al. 2009). Aggregation of D. abbreviatus adults and the occurrence of so-called “party trees” have been observed (Wolcott 1936). Schroeder (1981) suggested a male-produced pheromone attracted females and a female-produced pheromone attracted males. Beavers et al. (1982) showed in laboratory tests that male and female D. abbreviatus were significantly attracted to the frass of the opposite sex. Jones and Schroeder (1984) demonstrated a male-produced pheromone in the feces that attracted both sexes. A pheromone responsible for arrestment behavior was suggested by Lapointe and Hall (2009). U.S. Pat. No. 8,066,979 to Dickens et al. showed for the first time that D. abbreviatus adults have olfactory receptors for secondary plant metabolites that belong to diverse chemical groups: (a) alcohol and aldehyde monoterpenes (e.g., linalool, citronellal, nerol, and trans-geraniol), (b) green leaf volatiles (e.g., cis-3-hexen-1-ol and trans-2-hexen-1-ol), and (c) an aromatic monoterpenoid (e.g., carvacrol). Otálora-Luna et al. (2009) identified by gas-chromatograph electroantennograph detection (GC-EAD) a number of plant volatiles from citrus leaves that elicited antennal response in D. abbreviatus. Such kairomones may act in concert with a pheromone to attract conspecifics to a suitable food source (Dickens 1990). Only one pheromone, that of Sitona lineatus (4-methyl-3,5-heptanedione), an aggregation pheromone, has been isolated from the Entiminae (broad-nosed weevils) (Blight et al. 1984). Blight and Wadhams (1987) suggested that S. lineatus produces its aggregation pheromone in the spring and that the pheromone activity is synergized by host plant volatiles including (Z)-3-hexen-1-ol and linalool.

chromatographed again with hexanes/ethyl acetate/MeOH, 16:6:1 to furnish 1 (E/Z 86:14, approximately 90 mg, approximately 58%) in the less polar fraction.

1H NMR (600 MHz, C6D6, 6): 0.79 (d, J=6.6 Hz, (CH3)2, a 0.91 (d, J=6.6 Hz, (CH3)2, Z), 2.01-2.08 (m, H-4 E, CH2C═C, Z), 2.46 (t, J=5.4 Hz, OH, E), 2.76 (t, J=6.6 Hz, CH2C═C, E), 3.34 (s, OCH3, E), 3.36-3.38 (m, CH2OH, Z), 3.41 (s, OCH3, Z), 3.70 (q, J=5.4 Hz, CH2OH, E), 4.32 (septet, H-4, Z), 5.71 (br. s, H-2, Z), 5.80 (br. s, H-2, E).

13C NMR (151 MHz, C6D6, E isomer): 21.7 (two carbons), 35.6, 36.7, 51.1, 62.5, 115.6, 167.7, 168.7; Z isomer: 20.9 (two carbons), 29.8, 35.1, 50.8, 61.6, 116.0, 165.7, 166.8.

Lactone 2 (approximately 10 mg) was recovered from the more polar (second) fraction. GC-MS (m/z, relative intensity): 140 (M+, 16), 125 (7), 110 (15), 97 (19), 96 (59), 95 (96), 82 (24), 81 (100), 67 (73), 55 (17), 41 (40). 1H NMR (400 MHz, C6D6, 6): 0.57 (d, J=6.6 Hz, (CH3)2), 1.37 (br. t, J=6.5 Hz, CH2C═), 1.70 (septet, J=6.6 Hz, CH(CH3)2), 3.61 (t, J=6.5 Hz, CH2O), 5.67 (d, J=1.0 Hz, CHC═). NMR data are in agreement with ones obtained for this compound in CDCl(D’Annibale et al. 2007).


TABLE 1
HMBC and NOESY NMR spectroscopic data for the putative
pheromone of Diaprepes abbreviatus in CDCl3
Figure US20130189222A1-20130725-C00001
J coupling
δ 13C δ 1H constants HMBC
Position [ppm] [ppm] [Hz] correlations NOESY
1 169.0*
2 115.5 5.83 s 1.10
3 166.9*
4 36.35* 2.43 m J = 6.7
5 and 6 21.7 1.10 d, J = 6.8 C4, C3 5.83
and
2.84
7 35.2 2.84 t, J = 6.4 C2, C3, C4, 1.10
C8
8 62.5 3.8 br t J = 6.3
9 51.7 3.7 s Cl
1H (600 MHz), 13C (151 MHz),.
Chemical shifts referenced to δ(CHCl3) = 7.26 ppm for 1H and δ(CHCl3) = 77.36 ppm for 13C.
Coupling constants are given in Herzt [Hz].
*The 13C chemical shifts are deduced from HMBC; others are deduced from HSQC.
1H chemical shifts are deduced from 1D 1H NMR

lactone 2

TABLE 2
1H (600 MHz) and 13C (151 MHz) spectroscopic data for
the lactoneinactive degradation product of the putative
pheromone of Diaprepes abbreviatus found in
headspace collections
Figure US20130189222A1-20130725-C00002
δ 1H
.Position δ 13C [ppm] [ppm]
2 114.08 5.80
4 34.8 2.47
5 and 6 20.2 1.12
7 26.4 2.39
8 66.3 4.36
Only HSQC data are reported for the lactone.
Chemical shifts referenced to δ(CHCl3) = 7.26 ppm for 1H and δ(CHCl3) = 77.36 ppm for 13C.
Share

Examples of 1H NMR Spectra

 Uncategorized  Comments Off on Examples of 1H NMR Spectra
Jul 112014


These several pages contain some 1H nmr spectra , with annotations and comments. Try to understand why each spectrum looks as it does, including the approximate chemical shifts and the splitting patterns.

Figure of chemical shifts for different types of H


upfield and downfield regions of nmr spectra


The time has arrived to look at a few H-NMR spectra…..

H-NMR spectrum of methyl bromideH-NMR spectrun of 2-propanone
H-NMR spectra of methyl ethanoate

Coupling in H-NMR

So far the H-NMR spectra that we have looked at have all had different types of protons that are seen as singlets in the spectra.  This is not the normal case…. spectra usually have peaks that appear as groups of peaks due to coupling with neighboring protons, for example, see the spectra of 1,1-dichloroethane shown below.

H-NMR spectrum of 1,1-dichloroethane
H-NMR spectrun of 1-bromopropane
H-NMR spectrum of ethyl bromide

Compound, CH3X
CH3F
CH3OH
CH3Cl
CH3Br
CH3I
CH4
(CH3)4Si
X
F
O
Cl
Br
I
H
Si
Electronegativity of X
4.0
3.5
3.1
2.8
2.5
2.1
1.8
Chemical shift, d / ppm
4.26
3.4
3.05
2.68
2.16
0.23
0


H-NMR spectrum of ethyl bromide


In this spectrum the two methyls labeled (a) are homotopic, as are the two methylenes labeled (b).


  • The three Hs within each methyl are homotopic, and the two Hs within each methylene are enantiotopic.
  • Hence we get single absorptions for these groups, displaying the typical ethyl pattern of methyl triplet and CH2 quartet.
  • Note the numerical values for the integration shown under the chemical shift scale, which fit the 3 : 2 ratio of CH3 to CH2.

The two CH2 groups labeled (c) are homotopic (enantiotopic within the group) and therefore have the same chemical shift.


  • They are split to a triplet by the CH2 at (d).

The two Hs of (d) are enantiotopic and have the same chemical shift.


  • With a total of four equivalent neighbors (both (c) groups), (d) should be a quintet. The enlarged view shows this clearly.
  • The apparent small additional couplings seen are probably artifacts. The integration values fit the 2 : 1 ratio of (c) to (d).

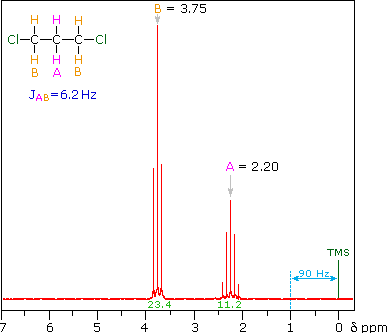
Part of the use we make of nmr spectra is simple pattern recognition. An ethyl is always triplet + quartet, although the separation between the two groups will vary according to the rest of the structure. A chain of three CH2 with no other neighbors is always triplet + quintet, again with variation in the separation on the chemical shift axis.


The proton NMR spectrum for aminorex and its structural assignments are provided in Fig. 2. Unlike the spectrum of methylaminorex, no upfield (<3 δ) absorbances characteristic of a methyl group occur in the 1H NMR spectrum of the  sample.

The obtained spectrum is indicative of the assigned structure of aminorex, with the phenyl group appearing at 7.35 δ, a benzylic methine triplet at 5.46 δ, the exchangeable amino group at 5.2 δ, and the nonequivalent hydrogens of the methylene group β to the phenyl ring at 4.13 and 3.65δ. The


The next spectrum illustrates several spectral features, including the unusual chemical shift of the aromatic hydrogen and an aldehyde H, and another characteristic alkyl splitting pattern.

The homotopic methyls at (a) and the unique H at (b) form an isopropyl (1-methylethyl) group, with an extremely characteristic pattern: doublet + septet, 6 : 1 integration ratio. As is often the case, we must expand the septet region to be able to see all seven peaks; if such an expansion is not available, the absorption may be referred to as a “multiplet”, meaning “There’s a bunch of lines there, but I can’t quite count ’em!”

The pattern of the hydrogens on the benzene ring, (c) and (d), is also typical – typical for a 1,4-disubstituted benzene (para-disubstituted) with groups that differ distinctly, so that the hydrogens next to one substituent are in a significantly different environment than those next to the other. The two widely separated doublets (one neighbor) show clearly in the expansion.

The benzene chemical shift arises from an induced circulation of electrons:


The aldehyde H in R-CHO is usually found shifted downfield to the neighborhood of 9.5 ppm by an induced circulation of the p-electrons of the C=O. In Ar-CHO the additional circulation of the p-electrons of the benzene ring produces a further shift, to the vicinity of 10 ppm.

The next spectrum illustrates accidental equivalence of chemical shift among benzene hydrogens, as well as splitting in another type of alkyl group.

The three groups, (a), (b), and (c) produce spectral features typical of propyl groups. A 3H methyl triplet for (a), split by the neighboring CH2 (b) is straightforward. Likewise, a 2H triplet for (c), also split by (b). The (b) CH2 actually has two differentgroups of neighbors. Nonetheless, because rotation within the alkyl group averages all the coupling constants to the typical alkyl 7.5 – 8 Hz, we see a sextet for (b), as if the CH2 and CH3 neighbors were a single CH5 group. Such behavior is quite common is acyclic structures.

The other feature of note is that although the benzene ring actually bears three different kinds of H (e, f, and g), the CH2substituent on the ring is not electronegative enough to induce a significant chemical shift difference between the hydrogens near it and those further away. Thus the five hydrogens accidentally have the same chemical shift in this spectrometer. An instrument with a more powerful magnet would spread out the spectrum still further, and show us the three expected absorptions.

This example illustrates diastereotopic hydrogens and the construction of a splitting tree to describe coupling to two different hydrogens.

In this spectrum, the diastereotopic alkene hydrogens, labeled Ha and Hb, have distinctly different chemical shifts. Hb is downfield, mixed in among the absorptions for the benzene hydrogens (b), (c), and (d). [Can you draw a resonance structure that explains why Hb is downfield from Ha?] Ha is coupled to both Hb and to the aldehyde H (a), which can be seen as a doublet near 10 ppm.

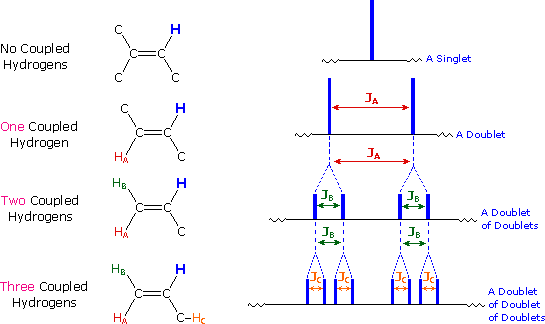
Since the two hydrogens to which Ha is coupled are different, we must apply the couplings separately in order to predict the observed splitting pattern. This is shown in the sketch below:

The coupling to Hbtrans- across a double bond, is quite large, and splits the Ha absorption into a doublet. Then the smaller coupling to (a) splits each half of the doublet again, giving a quartet. The kind of diagram shown here is called a “splitting tree”, and can be constructed for any case in which a group of nuclei is coupled to two distinctly different neighbors.


Let’s construct the splitting tree for this one:


Another example of an H NMR is shown below.

Typical H-nmr spectrum
Based on the outline given above the four sets of information we get are:

5 basic types of H present in the ratio of 5 : 2 : 2 : 2 : 3.
These are seen as a 5H “singlet” (ArH), two 2H triplets, a 2H quartet and a 3H triplet. Each triplet tells us that there are 2H in the adjacent position, and a quartet tells us that there are 3H adjacent.
(Think of it as the lines you see, L = n + 1, where n = number of equivalent adjacent H)
This tells us we that the peaks at 4.4 and 2.8 ppm must be connected as a CH2CH2 unit.
The peaks at 2.1 and 0.9 ppm as a CH2CH3 unit. Using the chemical shift charts, the H can be assigned to the peaks as below:


7.2ppm (5H) = ArH ;
4.4ppm (2H) = CH2O;
2.8ppm (2H) = Ar-CH2;
2.1ppm (2H) = O=CCH2CHand
0.9ppm (3H) = CH2CH3
more examples
In the 1H-NMR spectrum of 2-ethylphenol, the CH3 signal is a triplet, the CH2 signal is a quartet, the OH signal is a singlet, and the benzene ring protons signal is a multiplet.
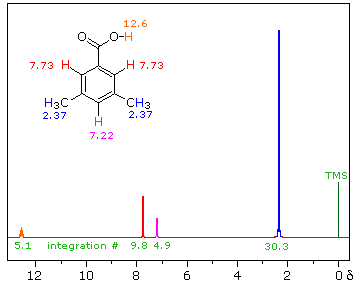
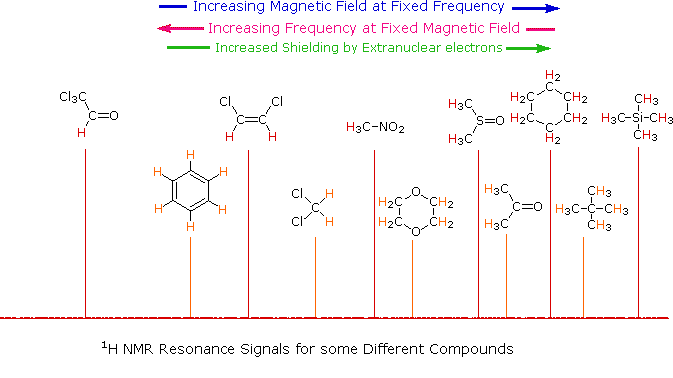
Some Typical 1H Chemical Shifts (δ values) in Selected Solvents
Solvent
Compound
CDCl3 C6D6 CD3COCD3 CD3SOCD3 CD3C≡N D2O
(CH3)3C–O–CH3
C–CH3
O–CH3
1.19 
3.22
1.07 
3.04
1.13 
3.13
 1.11
3.03
1.14 
3.13
1.21 
3.22
(CH3)3C–O–H
C–CH3
O–H
1.26 
1.65
1.05 
1.55
1.18 
3.10
1.11 
4.19
1.16 
2.18

C6H5CH3
CH3
C6H5
2.36 
7.15-7.20
2.11 
7.00-7.10
2.32 
7.10-7.20
2.30 
7.10-7.15
2.33 
7.15-7.30

(CH3)2C=O 2.17 1.55 2.09 2.09 2.08 2.22


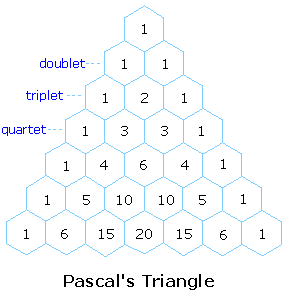
The splitting pattern of a given nucleus (or set of equivalent nuclei) can be predicted by the n+1 rule, where n is the number of neighboring spin-coupled nuclei with the same (or very similar) Js. If there are 2 neighboring, spin-coupled, nuclei the observed signal is a triplet ( 2+1=3 ); if there are three spin-coupled neighbors the signal is a quartet ( 3+1=4 ). In all cases the central line(s) of the splitting pattern are stronger than those on the periphery. The intensity ratio of these lines is given by the numbers in Pascal’s triangle. Thus a doublet has 1:1 or equal intensities, a triplet has an intensity ratio of 1:2:1, a quartet 1:3:3:1 etc. To see how the numbers in Pascal’s triangle are related to the Fibonacci series click on the diagram.
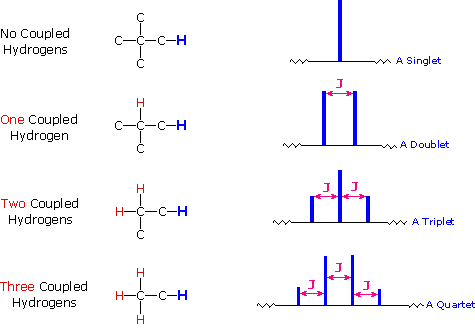
If a given nucleus is spin-coupled to two or more sets of neighboring nuclei by different J values, the n+1 rule does not predict the entire splitting pattern. Instead, the splitting due to one J set is added to that expected from the other J sets. Bear in mind that there may be fortuitous coincidence of some lines if a smaller J is a factor of a larger J.


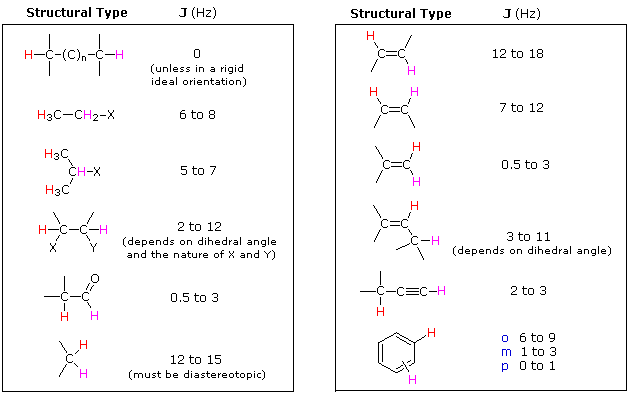
Magnitude of Some Typical Coupling Constants
<

R-O-H   +   D2O      R-O-D   +   D-O-H


Interpreting a H-NMR Spectrum

The NMR Spectrometer at  is graded at 300 MHz.  This means the Larmor frequency of a single, unaltered hydrogen nucleus and its electron with \sigma=0, is 300 MHz.  The magnetogyric ratio \gamma of a hydrogen nucleus is 267.513*10^{6}\frac{rad}{T•s} .  A quick calculation using:

(1) \begin{equation*} \nu_{0}=\frac{\gamma B_{0}(1-\sigma)}{2\pi} \end{equation*}

shows the magnetic field strength of the NMR is roughly 7.046 T.

Using this information and the ^{1}H-NMR spectrum, we can calculate shielding factors for each type of hydrogen nucleus in 3,3-dimethyl-2-butanol, and determine what each spectrum peak actually means.

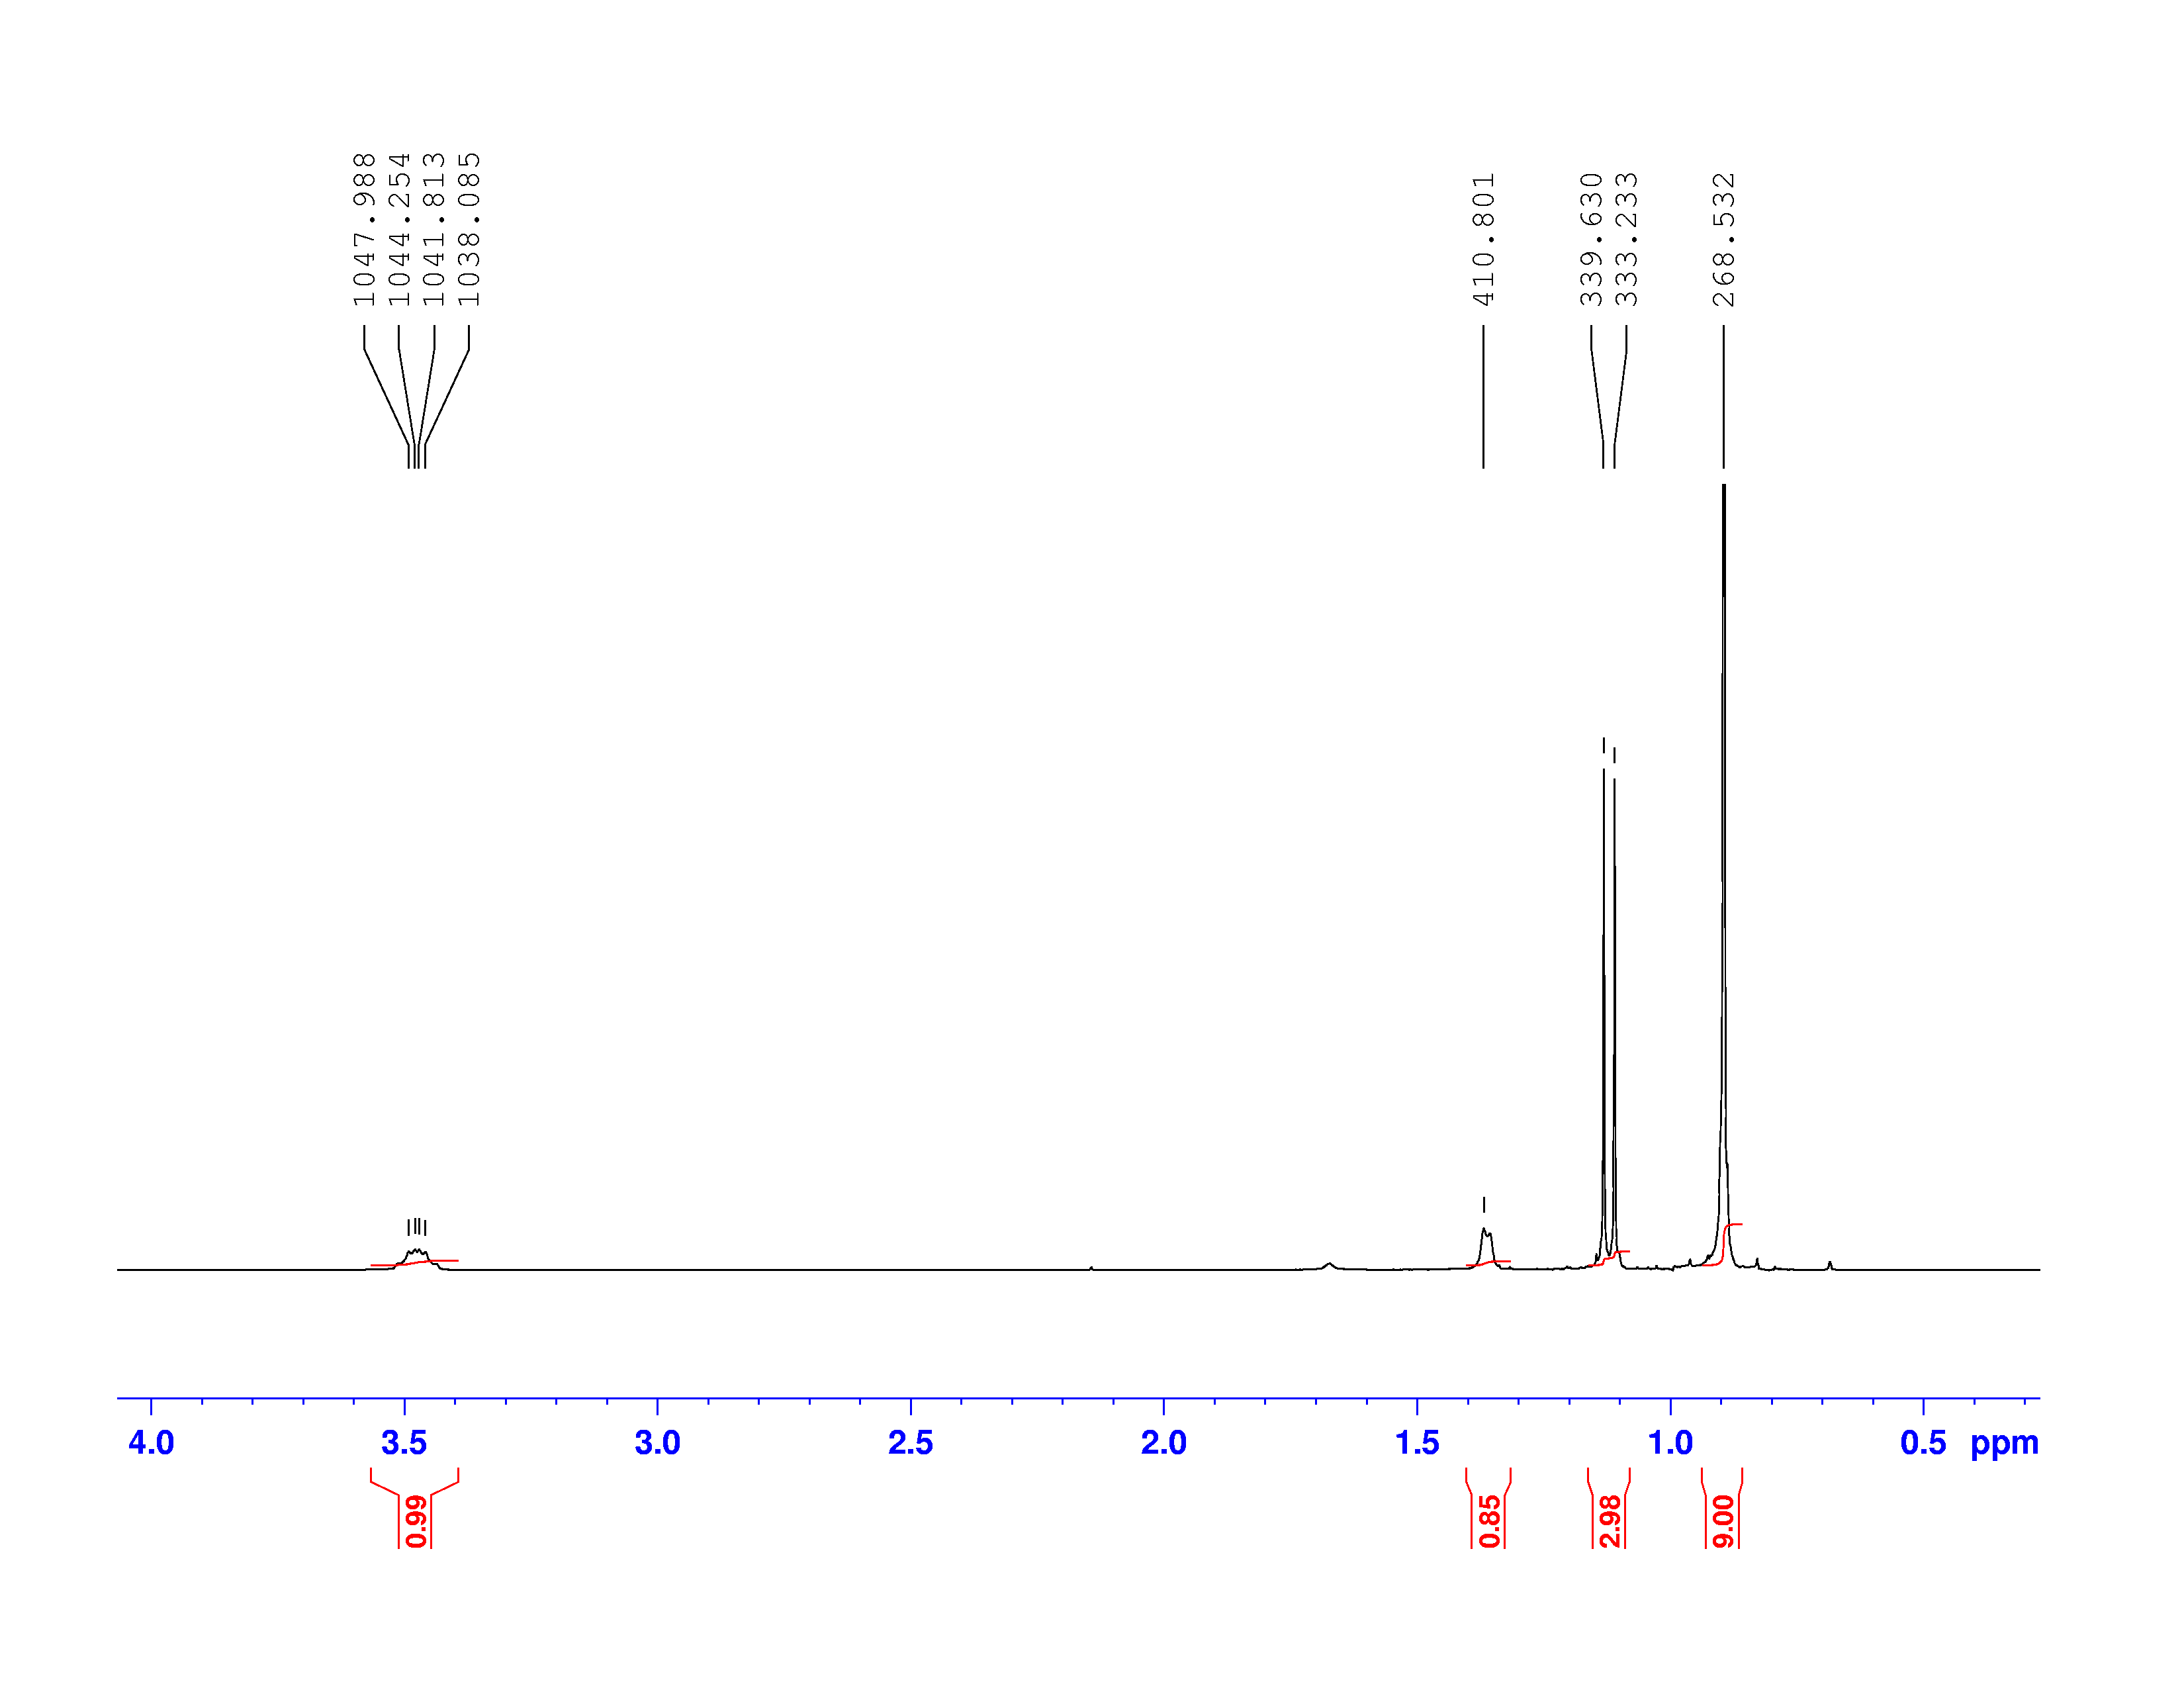
Let’s start with the peak farthest to the right on the spectrum.  It is a single peak, called a singlet, that represents nine hydrogens, and is centered at approximately 0.9 ppm on the x-axis.  The ppm scale measures how much the Larmor frequency of hydrogen is changed by the effective magnetic field.  The Larmor frequency of the hydrogens represented by the first peak was increased by 0.9 ppm of the initial 300 MHz frequency.  A calculation of these hydrogens’ shielding factor follows using equation (1):

300 MHz+(\frac{0.9 ppm}{10^{6}}*300 MHz)=\frac{267.513*10^{6}\frac{rad}{T•s}*7.046T*(1-\sigma)}{2\pi}

300000270 Hz=299990611 Hz(1-\sigma)

\sigma=-3.2198*10^{-5}

Shielding factors tend to be small for most hydrogen nuclei.  A table of chemical shift and shielding factor values for each hydrogen nucleus in 3,3-dimethyl-2-butanol is below.

A more negative shielding factor corresponds with a lower electron density around the hydrogen nucleus and with a larger effective magnetic field influencing the nucleus.  The presence of very electronegative atoms, like oxygen, near the hydrogen causes increased chemical shifts like the 3.5 ppm shift in the table.

One peak in the spectrum above is split into two peaks centered around the chemical shift  1.1 ppm.  This splitting occurs because there is another magnetically active hydrogen nucleus nearby in the molecule.  The rule for split peaks is: the number of nearby hydrogens is given by n-1, where n is the number of peaks.  The definition of “nearby” is usually 1 carbon atom over in the molecule from the one the original hydrogen is attached to.

The figure below shows the structure of 3,3-dimethyl-2-butanol with the hydrogens labeled with their corresponding chemical shifts.  This will be the first step in reconstructing the molecule from the NMR data.


ANTHONY MELVIN CRASTO

THANKS AND REGARD’S
DR ANTHONY MELVIN CRASTO Ph.D

amcrasto@gmail.com

MOBILE-+91 9323115463
GLENMARK SCIENTIST ,  INDIA
web link
アンソニー     安东尼   Энтони    안토니     أنتوني
blogs are
 

 MY CHINA, VIETNAM  AND JAPAN BLOGS

http://me.zing.vn/u/amcrasto

ICELAND, RUSSIA, ARAB

BOBRDOBRBLAND ICELAND100zakladokadfty

GROUPS

you can post articles and will be administered by me on the google group which is very popular across the world

OPD GROUPSPACESSCOOP OCIorganic-process-development GOOGLE, TVINX,

shark


Share

Ethyl 3-oxohexanoate エチル=3-オキソヘキサノアテ NMR

 Uncategorized  Comments Off on Ethyl 3-oxohexanoate エチル=3-オキソヘキサノアテ NMR
Jul 062014


Ethyl 3-oxohexanoate

Cas Number: 3249-68-1

Formula: C8H14O3

The Journal of Organic Chemistry, 44, p. 310, 1979 DOI: 10.1021/jo01316a039

C8H14O3
Rule 2, omit O, gives C8H14
8 – 14/2 + 1 = 2 degrees of unsaturation.
Look for 2 pi bonds or aliphatic rings, or 1 of each.


Structure answer

NMR answer

Even though A, B, C and D are all 2H peaks, they can be distinguished by chemical shift and splitting. B is outside the normal range for protons next to carbonyls, because it’s adjacent to both carbonyls and the combined deshielding is higher than normal.

The bands at 1745 and 1716 indicate that there are two carbonyls, probably an aliphatic ester and an aliphatic ketone. The bands at 3000-2850 indicate C-H alkane stretches.

H1 NMR Spectrum: Predict NMR spectrum


丁酰乙酸乙酯

ir


IR spectrum


The bands at 1745 and 1716 indicate that there are two carbonyls, probably an aliphatic ester and an aliphatic ketone. The bands at 3000-2850 indicate C-H alkane stretches.


MASS


丁酰乙酸乙酯

Share

p-Anisaldehyde, or 4-methoxybenzaldehyde. NMR

 Uncategorized  Comments Off on p-Anisaldehyde, or 4-methoxybenzaldehyde. NMR
Jul 042014
 
p-anisaldehyde, or 4-methoxybenzaldehyde.
(C8H8O2)

This 13C spectrum exhibits resonances at the following chemical shifts, and with the multiplicity indicated:

Shift (ppm)
190.8 130.2
154.6 114.5
132.0 55.4


55.4……….. -0CH3

114.5………TWO AROM -CH ORTHO TO O ATOM

130.2……..AROM C OF -CHO

132……….TWO AROM -CH ORTHO TO -CHO

154.6……….AROM  C OF -OGP

190.8……. CH=O GP

1H NMR

FIRST SIGNAL IS 3H OF CH3


SECOND IS DOUBLET OF TWO H OF AROM RING ORTHO TO O ATOM


THIRD IS DOUBLET OF TWO H OF AROM RING ORTHO TO -CHO GP


LAST IS LONE H OF CHO

IR
ANTHONY MELVIN CRASTO

THANKS AND REGARD’S
DR ANTHONY MELVIN CRASTO Ph.D

amcrasto@gmail.com

MOBILE-+91 9323115463
GLENMARK SCIENTIST ,  INDIA
web link
http://anthonycrasto.jimdo.com/

Congratulations! Your presentation titled “Anthony Crasto Glenmark scientist, helping millions with websites” has just crossed MILLION views.
アンソニー     安东尼   Энтони    안토니     أنتوني
join my process development group on google
you can post articles and will be administered by me on the google group which is very popular across the world
LinkedIn group
 
blogs are
 
shark


Share

NMR EXAMPLE

 Uncategorized  Comments Off on NMR EXAMPLE
May 152014
 

<br /><br />
			Reaction Scheme: <IMG src="/images/empty.gif">Deprotection of a tert-butyldimethylsilyl ether<IMG src="/images/empty.gif">


1H NMR (300 MHz; (CD3)2CO)
11.76 (1 H, s, OH (naph.) [exch]),
8.74 (1 H, dd, J 8.5 and 1.0, naph.),
8.10 (1 H, d, J 9.0, naph.),
7.89 (1 H, dd, J 8.5 and 1.5, naph.),
7.86 (1 H, dd, J 6.5 and 2.0, cyclop.),
7.59 (1 H, ddd, J 8.5, 7.0 and 1.5, naph.),
7.41 (1 H, ddd, J 8.5, 7.0 and 1.0, naph.),
7.22 (1 H, d, J 9.0, naph.),
6.50 (1 H, dd, J 6.5 and 2.0, cyclop.),
6.18 (1 H, q, J 2.0, cyclop.),
5.26 (1 H, d, J 5.5, OH (cyclop.) [exch]),
4.69 (1 H, dd, J 5.5 and 2.0, cyclop.)


Reference s

J. H. Clark, Chem. Rev., 1980, 80, 429 doi:10.1021/cr60327a004
E. J. Corey, A. Venkateswarlu, J. Am. Chem. Soc., 1972, 94, 6190 doi:10.1021/ja00772a043
A. B. Smith, III, G. R. Ott, J. Am. Chem. Soc., 1996, 118, 3095 (TBAF/AcOH)
K. C. Nicolaou, S. E. Webber, Synthesis, 1986, 453 (HF.py) doi:10.1055/s-1986-31673
Share

Sucrose 2D NMR Spectra

 Uncategorized  Comments Off on Sucrose 2D NMR Spectra
Apr 062014
 

Sucrose 2D NMR Spectra

The sugar sucrose can be used to illustrate  homonuclear 2D NMR experiment: the TOCSY.

Sucrose

Sucrose

Table sugar

Sucrose (“table sugar”) is a disaccharide derived from glucose and fructose.

The interesting element from an NMR spectroscopy viewpoint is that the two monomer units are completely separate spin systems and this can be visualised in the TOCSY spectrum.

HH COSY

HH COSY

The HH COSY shows the coupling network within the molecule.

HH TOCSY

HH TOCSY

The HH TOCSY spectrum shows correlations that belong together in contiguous spin systems: in the sucrose example, this means that the protons in the respective glucose and fructose units can be assigned.

HMQC

HMQC

In the HMQC spectrum the one-bond direct HC couplings can be viewed as cross-peaks between the proton and carbon projections.

HMBC

HMBC

Share
Follow

Get every new post on this blog delivered to your Inbox.

Join other followers: