AUTHOR OF THIS BLOG

DR ANTHONY MELVIN CRASTO, WORLDDRUGTRACKER

REDUCTION OF C=O GROUP

 Uncategorized  Comments Off on REDUCTION OF C=O GROUP
Jul 202014
 

– the reduction of carbonyl compounds is one of the most important synthetic reactions

– the catalytic enantioselective reduction of C=O has been achieved using:

* chiral oxazaborolidines and other related boronates (H3B as a source of hydrogen)

here is an example

* transition metal catalysts (H2 as a source of hydrogen)

here is an example


– first described by Itsuno et al. who observed that valinol reacts with 1 mol eq. of borane by producing 1 ml eq. of hydrogen gas and giving rise to the alkoxyborane derivative shown below:

here is an example

– the aminoalkoxyborane derivatives (A and B) shown below are a result of the reaction of valinol with 2 eq. of borane (producing 2 mol eq. of hydrogen gas)

here is an example

– the resulting aminoalkoxyborane (A or B) was found to catalyze the enantioselective reduction of PhCOMe

– the optical yield of the reduction was found to depend on the relative amounts of valinol and borane

here is an example

– maximum optical yeild is reached with a borane-valinol ratio of 2.0

– the optical yeild remains almost constant within the borane-valinol ratio range of 2.0-3.0

– Itsuno et al. observed significantly higher optical yeilds when the hydrogens attached to the carbon atom of the terminal hydroxyl group were replaced by bulky groups, such as phenyls

here is an example

– in the case of ketones other than aromatic ones optical yeilds were lower

here is an example

here is an example

– the optical yeild increases with the increasing difference in the volume of the substituents of the ketone

– an unusual relation between the optical yeild and reaction temperature was observed (studied by Itsuno et al. using methyl-tert-butyl ketone as a test system)

here is an example

– the catalyst was found to work with more efficiency near 0 °C than at -78 °C

– reductions of functionalized ketones were studied

here is an example

Other related reductions: (by Itsuno et al.)

here is an example

– best optical yeilds were observed in the case of halohydrin formation

– the halohydrins were converted to form optically active epoxides without rasemization

here is an example

– the reduction works best with chlorinated acetophenones

– two years latter Corey et al. developed the ideas of Itsuno et al. further and described a new and better catalyst (an oxazaborolidine derived from diphenylprolinol)

here is an example

here is an example

– the oxazaborolidine derived from diphenylprolinol gave better enantioselectivities for arylalkyl ketones than diphenylvalinol based derivatives

– Corey et al. proposed a mechanism for the catalytic reduction

here is an example


– proline based oxazaborolidines are also known as CBS (Corey,Bakshi,Shibata) catalysts

– the better performance of CBS catalysts, relative to the performance of valinol-based catalysts, was related (by Corey et al.) to the higher angle strain on the partial B=N double bond at the 5,5-ring fusion

here is an example

– the angle strain disturbs PI-resonance (A) and exposes the lone pair of the nitrogen atom (B) for borane to coordinate

here is an example

– in THF (needed to stabilize highly polar reactive intermediates) the borane atom is not totally coordinated to the catalyst:

here is an example

– the bicyclic (CBS) catalyst is capable of binding the borane more tightly than the related monocyclic system

– the more strained the B-N bond, the higher the proportion of catalyst present as a borane complex (ready to operate as a chiral catalyst)

– computational studies on the CBS catalyst indicate that not all atoms adjacent to the borane and nitrogen atoms of the partial B=N bond lie in the same plane (for the related torsion angles at 0 °C/180 °C +/- 22 °C see THA 3,1563(1992))

– similar distortions were not observed with monocyclic oxazaborolidines

– the rigidity of the structure of CBS catalysts would also orient the borane to coordinate selectively on one of the faces of the oxazaborolidine ring

– coordination on the faces would involve:

* an attack on the less hindered side of the ring system (kinetic control)

here is an example

* the formation of a 5,5,-cis-fused ring system is favoured over that of the highly strained 5,5-trans-fused system (thermodynamic control)

here is an example


– in the formation of borane adducts of CBS catalysts only one adduct (lowering angle strain) is formed selectively

– other isomers of borane-oxazaborolidine adducts have also been considered, e.g.

here is an example

– the system containing a hydride-bridged 6-ring was found to be more stable than the other diborane adducts

– the formation of hydride-bridged adducts indicates that the hydrogens of borons “scramble” in a mixture of borane and oxazaborolidine(s)

– this hydrogen – deuterium exchange “scrambling” has been observed experimentally [Tlahuext and Contreras, THA 5, 395 (1994)]

here is an example

– an X-ray study on a borane adduct of a CBS catalyst (a B-methylated derivative) proves that the borane atom coordinates to the nitrogen atom

– the X-ray structure of the N-adduct proves that the formation of N-adducts is possible and probably even favoured over the other adducts; nevertheless, the involvement of borane O-adducts of oxazaborolidines (as reactive intermediates) cannot completely be ruled out

– the mechanism of catalysis in the case of monocyclic systems has been proposed to be controlled by factors partially different from those controlling CBS catalysis

– the selectivity of the formation of borane cis/trans-adducts of monocyclic oxazaborolidines (e.g. those derived from valinols) has been calculated to be too low to fit the experimentally observed enantioselectivities, e.g. in the case of the simple model shown below:

here is an example

– computational studies on simple models imply that the next step in the mechanistic cycle of catalysis should show significant selectivity

here is an example

…………


– one of the most significant consequences of the N-coordination of borane to an oxazaborolidine is the substantially enhanced acidity of the ring boron [intramolecular stabilization through the partial PI-bond between the boron and adjacent nitrogen atom is not possible in the N-adduct]

– computational studies on the formation of N-O- and N,O-(di)adducts (related to LUMO energies) imply that the parent oxazaborolidine is the weakest Lewis acid (highest LUMO energy), the borane N,O-diadduct being the strongest (lowest LUMO energy)

here is an example

– the more the borane coordinates to the N- and O- atoms of an oxazaborolidine ring the less the ring boron is stabilized by partial PI-bonding

here is an example

– not only are there differences in the Lewis acidities of the borane N- and O-adducts, but there are also many possible orientations from which a Lewis base (in this case a ketone) can best approach the ring boron

here is an example

– in the case of borane N-adducts the orientation of the dipole moment favours the coordination of ketones

– in the case of borane O-adducts the orientation of the dipole moment is not particularly favourable; the incoming Lewis base has to approach the ring boron in the plane of the ring (this inhibits binding)!

– the orientation of the dipole moment of the borane N-adduct of the parent oxazaborolidine implies that the ketone (or any Lewis base) could react to form a borane-ketone cis-adduct

– the 5,5-diphenyl substituents direct the ketone to favour the anti-conformation over the syn-conformation (see the figure below)

here is an example

– the structures of both the syn- and anti-adducts a borane-formaldehyde complex coordinating to the parent oxazaborolidine have been generated and assessed using computational methods

– these simple models, extended with two phenyl groups on C-5 of the oxazaborolidine ring (the orientations of the phenyls were set on the basis of the orientations of the corresponding hydrogens), show how hindered the syn-conformation is in the case of oxazaborolidines bearing bulky substituents on C-5

here is an example

– plausible conformations of both the anti- and syn-adducts and the related transition states of the hydride transfer have been studied computationally

here is an example

– the hydride transfer taking place in the borane-ketone adducts of oxazaborolidines has been proposed to lead to the formation of an intramolecular adduct of an alkoxyborane, which in turn results in the formation of an aminoborane (A)

– the aminoborane can react further to form an oxazadiboretane (structure B)

here is an example

– the oxazaboretane system (B) may undergo a number of reactions, one of which leads to the regeneration of the catalyst, whereas another leads to the formation of an alkoxyborane adduct analogous to the original borane adduct of oxazaborolidine

here is an example

– NMR studies performed on the products of the related stoichiometric reduction carried out in the presence of Et3N gave the alkoxyborane

here is an example

– a few other examples:

here is an example

– further NMR studies on the products formed in the reduction of acetaldehyde with the same catalyst led to the structural interpretations shown below:

here is an example

– on the basis of data obtained with 13C-NMR studies, it is not clear whether the species the signals originate from are oxazadiboretanes or their related openchain isomers (of which the latter ones are shown in the figure above)

– the results indicate that the first (of the two) hydride transfer(s) occurs with higher enantioselectivity than the second

here is an example

– in addition to the mechanism of the regeneration of the catalyst discussed above, another plausible pathway has been proposed on the basis of computational studies carried out on hydride-bridged adducts of borane coordinated to oxazadiboretanes

– the regeneration of oxazaborolidine catalysts used in the enantioselective reduction of ketones was proposed to involve the hydride-bridged adduct shown below (two conformers; H2C=O as a model of the ketone and the parent oxazaborolidine as a model of the catalyst)

here is an example

– the energies of the insertion of borane into oxazadiboretanes are rather low relative to those involved with most energy requiring/liberating steps in the reduction

…………


– the latest mechanistic proposal (on the basis of a computational AM1 study) is shown below:

here is an example

– in contrast to the results of NMR studies on the model reaction of CBS reduction (H3C-CHO as a model of ketones), an alkoxyborane adduct (structurally analogous to that of the related borane adduct) is not included in the mechanism

– although the mechanism of the CBS reduction is not completely clear at this time, the stereochemical outcome of the reduction can easily be predicted

– boranes other than BH3 can also be used as a source of hydrogen in CBS reductions; e.g. catecholborane shown below


here is an example


here is an example

– in addition to the enantioselective synthesis of epoxides (Itsuno et al.), the products of these enantioselective reductions have been converted to many valuable compounds

a) The enantioselective synthesis of ALPHA-amino-acids (including unnatural ones)

here is an example

b) The enantioselective synthesis of ALPHA-hydroxy-acids

here is an example

c) The enantioselective synthesis of 1-deuterio primary alcohols

here is an example

d) The enantioselective synthesis of benzylic thiols

here is an example

e) The enantioselective synthesis of oxiranes

here is an example


here is an example

– in the case of CBS reductions, the coordination site of the ketone is usually determined by the difference in bulkiness of the substituents (RL and RS), but other selection mechanisms also exist

– any effect making one of the two lone pairs on the carbonyl oxygen atom of a ketone more basic than the other should work, e.g. CBS reduction of benzophenones

here is an example

– the lone pair “a” (trans to the donating group) should be more basic

– two transition states:

here is an example

– the formation of A (stabililzed by PI-electron donation from the p-OR group) should be favoured over B

– the stereochemical outcome of the reduction corresponds to the transition state A

– high selectivities are observed (although both substituents of the ketone being reduced are almost equally bulky)

here is an example


here is an example

– polymer-bound chiral oxazaborolidines have also been shown to work with enantioselectivities similar to those of their free monomeric analogs, e.g.

here is an example


here is an example

– the reduction of acetophenone using this polymeric catalyst gave 95% ee (the corresponding monomeric catalyst gave 97% ee)

– it has been shown that oxazaborolidines of which the basicity of the ring nitrogen has been reduced can also be utilized in the enantioselective reduction performed using oxazaborolidines

– in these catalysts:

* the basicity of the ring nitrogen has been reduced by an electron withdrawing substituent (e.g. Me-SO2)

* one of the bulky 5,5-substituents has been removed (one face of the ring has been made more accessible than the other)

* the bulky 5-substituent of the H3O-adduct affords an axial conformation in which it:

a) is almost orientated against the plane of the sp2-hybridized oxygen of the ring, e.g.

here is an example

b) substituents 4 and 5 are trans about the ring (otherwise repulsive interactions between the substituents will exist)

the substituents of the ring:

c) will block one face of the borane-oxazaborolidine O-adduct (the incoming ketone can approach the Lewis acidic boron with greater ease than from the face opposite the 5-substituent)

d) will direct the coordination of the incoming ketone towards an equatorial conforamation [the substituent of the boron (e.g. H) being cis to the bulky 5-substituent]

e) orient the coordinated H3B optimally (if the 5-substituent is in an equatorial conformation, the borane bound to the ring oxygen will reside far from the carbonyl carbon of the coordinated ketone)


here is an example

(a complex in which the ketone is in an equatorial conformation would have even more problems)

here is an example


here is an example


here is an example
Share

Identification and synthesis of a male-produced pheromone for the neotropical root weevil diaperpes abbreviatus (coleoptera: curculionidae) US 20130189222 A1

 Uncategorized  Comments Off on Identification and synthesis of a male-produced pheromone for the neotropical root weevil diaperpes abbreviatus (coleoptera: curculionidae) US 20130189222 A1
Jul 202014
 

1= methyl (E)-3-(2-hydroxyethyl)-4-methyl-2-pentenoate+methyl (E)-3-(2-hydroxyethyl)-4-methyl-2-pentenoate

2=

http://www.google.com/patents/US20130189222?cl=en

an unsaturated hydroxy ester pheromone collected from the headspace and feces of male Diaprepes abbreviatus was isolated, identified and synthesized. The pheromone, methyl (E)-3-(2-hydroxyethyl)-4-methyl-2-pentenoate, was discovered by gas chromatography-coupled electroantennogram detection (GC-EAD) and identified by gas chromatography-mass spectrometry (GC-MS) and nuclear magnetic resonance spectroscopy (NMR). The synthetic protocol yielded a 86:14 mixture of methyl (E)-3-(2-hydroxyethyl)-4-methyl-2-pentenoate and an inactive methyl (Z)-3-(2-hydroxyethyl)-4-methyl-2-pentenoate along with a lactone decomposition product. The activity of the synthetic E isomer was confirmed by GC-EAD, GC-MS, NMR and behavioral assays. No antennal response was observed to the Z isomer or the lactone. In a two-choice olfactometer bioassay, female D. abbreviatus moved upwind towards the synthetic pheromone or a source of natural pheromone more often as compared to clean air. Males showed no clear preference for the synthetic pheromone.


The root weevil Diaprepes abbreviatus (L.), is a major pest of citrus in the Caribbean and Florida. Prior to the 1960’s, D. abbreviatus was reported only in the Caribbean. Because multiple phenotypic populations occur on Puerto Rico it is suggested that D. abbreviatus originated in Puerto Rico (Lapointe 2004). Since its discovery near Apopka, Fla. in 1964, it has spread to Louisiana, Texas and California. There is no geographic or climatic barrier to prevent the southern movement of this insect to Mexico, Mesoamerica and South America (Lapointe et al. 2007).

This migration is of concern because this insect is destructive. Adult beetles of D. abbreviatus oviposit and feed on leaves of a wide range of hosts including more than 270 species of plants in 59 plant families. Feeding by adults on leaves causes a characteristic notching pattern; however, the larval stage causes the most serious damage. Neonate larvae fall to the ground and burrow into the soil where they feed on progressively larger roots over a period of months as they grow. Larval feeding on citrus tree roots can eventually girdle the crown area of the root system, killing the host plant. When larval development is completed, adults emerge from the soil to feed upon foliage where aggregation, mating and oviposition take place. In certain citrus growing areas, root damage by larval D. abbreviatus creates favorable conditions for species ofPhytophthora, a very serious and often lethal plant pathogen, to invade roots and further hasten the decline of trees.

In Florida, citrus growers spend up to $400/acre for combined control of D. abbreviatus and Phytophthora. In 2009, it was estimated that the total increase in costs per ton due to the establishment and spread of Diaprepes root weevil in California would be $53.60 for orange, $45.20 for grapefruit, $42.50 for lemon and $200.00 for avocado. In view of the negative economic impact caused by the feeding of this insect and in view of the fact that there appear to be no natural barriers to important agricultural citrus growing areas, attractants that will allow for the monitoring, tracking, trapping and destroying of this insect have been sought.

Diaprepes abbreviatus has been placed in the subfamily Entiminae of the Curculionidae (Marvaldi et al. 2002) Within the superfamily Cu rculionoidea (weevils) the majority of attractants or pheromones identified to date are long-range, male-produced aggregation pheromones (Seybold and Vanderwel 2003, Ambrogi et al. 2009). Aggregation of D. abbreviatus adults and the occurrence of so-called “party trees” have been observed (Wolcott 1936). Schroeder (1981) suggested a male-produced pheromone attracted females and a female-produced pheromone attracted males. Beavers et al. (1982) showed in laboratory tests that male and female D. abbreviatus were significantly attracted to the frass of the opposite sex. Jones and Schroeder (1984) demonstrated a male-produced pheromone in the feces that attracted both sexes. A pheromone responsible for arrestment behavior was suggested by Lapointe and Hall (2009). U.S. Pat. No. 8,066,979 to Dickens et al. showed for the first time that D. abbreviatus adults have olfactory receptors for secondary plant metabolites that belong to diverse chemical groups: (a) alcohol and aldehyde monoterpenes (e.g., linalool, citronellal, nerol, and trans-geraniol), (b) green leaf volatiles (e.g., cis-3-hexen-1-ol and trans-2-hexen-1-ol), and (c) an aromatic monoterpenoid (e.g., carvacrol). Otálora-Luna et al. (2009) identified by gas-chromatograph electroantennograph detection (GC-EAD) a number of plant volatiles from citrus leaves that elicited antennal response in D. abbreviatus. Such kairomones may act in concert with a pheromone to attract conspecifics to a suitable food source (Dickens 1990). Only one pheromone, that of Sitona lineatus (4-methyl-3,5-heptanedione), an aggregation pheromone, has been isolated from the Entiminae (broad-nosed weevils) (Blight et al. 1984). Blight and Wadhams (1987) suggested that S. lineatus produces its aggregation pheromone in the spring and that the pheromone activity is synergized by host plant volatiles including (Z)-3-hexen-1-ol and linalool.

chromatographed again with hexanes/ethyl acetate/MeOH, 16:6:1 to furnish 1 (E/Z 86:14, approximately 90 mg, approximately 58%) in the less polar fraction.

1H NMR (600 MHz, C6D6, 6): 0.79 (d, J=6.6 Hz, (CH3)2, a 0.91 (d, J=6.6 Hz, (CH3)2, Z), 2.01-2.08 (m, H-4 E, CH2C═C, Z), 2.46 (t, J=5.4 Hz, OH, E), 2.76 (t, J=6.6 Hz, CH2C═C, E), 3.34 (s, OCH3, E), 3.36-3.38 (m, CH2OH, Z), 3.41 (s, OCH3, Z), 3.70 (q, J=5.4 Hz, CH2OH, E), 4.32 (septet, H-4, Z), 5.71 (br. s, H-2, Z), 5.80 (br. s, H-2, E).

13C NMR (151 MHz, C6D6, E isomer): 21.7 (two carbons), 35.6, 36.7, 51.1, 62.5, 115.6, 167.7, 168.7; Z isomer: 20.9 (two carbons), 29.8, 35.1, 50.8, 61.6, 116.0, 165.7, 166.8.

Lactone 2 (approximately 10 mg) was recovered from the more polar (second) fraction. GC-MS (m/z, relative intensity): 140 (M+, 16), 125 (7), 110 (15), 97 (19), 96 (59), 95 (96), 82 (24), 81 (100), 67 (73), 55 (17), 41 (40). 1H NMR (400 MHz, C6D6, 6): 0.57 (d, J=6.6 Hz, (CH3)2), 1.37 (br. t, J=6.5 Hz, CH2C═), 1.70 (septet, J=6.6 Hz, CH(CH3)2), 3.61 (t, J=6.5 Hz, CH2O), 5.67 (d, J=1.0 Hz, CHC═). NMR data are in agreement with ones obtained for this compound in CDCl(D’Annibale et al. 2007).


TABLE 1
HMBC and NOESY NMR spectroscopic data for the putative
pheromone of Diaprepes abbreviatus in CDCl3
Figure US20130189222A1-20130725-C00001
J coupling
δ 13C δ 1H constants HMBC
Position [ppm] [ppm] [Hz] correlations NOESY
1 169.0*
2 115.5 5.83 s 1.10
3 166.9*
4 36.35* 2.43 m J = 6.7
5 and 6 21.7 1.10 d, J = 6.8 C4, C3 5.83
and
2.84
7 35.2 2.84 t, J = 6.4 C2, C3, C4, 1.10
C8
8 62.5 3.8 br t J = 6.3
9 51.7 3.7 s Cl
1H (600 MHz), 13C (151 MHz),.
Chemical shifts referenced to δ(CHCl3) = 7.26 ppm for 1H and δ(CHCl3) = 77.36 ppm for 13C.
Coupling constants are given in Herzt [Hz].
*The 13C chemical shifts are deduced from HMBC; others are deduced from HSQC.
1H chemical shifts are deduced from 1D 1H NMR

lactone 2

TABLE 2
1H (600 MHz) and 13C (151 MHz) spectroscopic data for
the lactoneinactive degradation product of the putative
pheromone of Diaprepes abbreviatus found in
headspace collections
Figure US20130189222A1-20130725-C00002
δ 1H
.Position δ 13C [ppm] [ppm]
2 114.08 5.80
4 34.8 2.47
5 and 6 20.2 1.12
7 26.4 2.39
8 66.3 4.36
Only HSQC data are reported for the lactone.
Chemical shifts referenced to δ(CHCl3) = 7.26 ppm for 1H and δ(CHCl3) = 77.36 ppm for 13C.
Share

Examples of 13C NMR Spectra

 Uncategorized  Comments Off on Examples of 13C NMR Spectra
Jul 182014
 

No one will present better………..

Examples 13C NMR Spectra

Here are a couple of examples for judging 13C chemical shifts:

Minimum description used……..mostly pictorial

Start with benzene

Then toluene


Remember that 13C shifts generally follow the pattern of 1H shifts, but are much larger.

Thus, in (a)

  • The peak at lowest field is the caarbon with the OH attached
  • The peak at highest field is the CH3 farthest from the OH
  • Generally in both 13C and 1H spectra, CH2 groups fall to lower field than CH3, which assigns the remaining peaks.

For (b):

  • The peak at lowest field is the C=O carbon, shifted by electronegativity and “diamagnetic anisotropy”
  • Assignment of the other two peaks follows from the CH2 lower than CH3 rule.

Now try predicting the splitting pattern to be found if the decoupler is turned off.


Taking a close look at three C-13 NMR spectraThe C-13 NMR spectrum for ethanol

  Remember that each peak identifies a carbon atom in a different environment within the molecule. In this case there are two peaks because there are two different environments for the carbons.The carbon in the CH3 group is attached to 3 hydrogens and a carbon. The carbon in the CH2 group is attached to 2 hydrogens, a carbon and an oxygen.So which peak is which?You might remember from the introductory page that the external magnetic field experienced by the carbon nuclei is affected by the electronegativity of the atoms attached to them. The effect of this is that the chemical shift of the carbon increases if you attach an atom like oxygen to it. That means that the peak at about 60 (the larger chemical shift) is due to the CH2 group because it has a more electronegative atom attached.

A table of typical chemical shifts in C-13 NMR spectra
carbon environment chemical shift (ppm)
C=O (in ketones) 205 – 220
C=O (in aldehydes) 190 – 200
C=O (in acids and esters) 170 – 185
C in aromatic rings 125 – 150
C=C (in alkenes) 115 – 140
RCH2OH 50 – 65
RCH2Cl 40 – 45
RCH2NH2 37 – 45
R3CH 25 – 35
CH3CO- 20 – 30
R2CH2 16 – 25
RCH3 10 – 15

In the table, the “R” groups won’t necessarily be simple alkyl groups. In each case there will be a carbon atom attached to the one shown in red, but there may well be other things substituted into the “R” group.

If a substituent is very close to the carbon in question, and very electronegative, that might affect the values given in the table slightly.

For example, ethanol has a peak at about 60 because of theCH2OH group. No problem!

It also has a peak due to the RCH3 group. The “R” group this time is CH2OH. The electron pulling effect of the oxygen atom increases the chemical shift slightly from the one shown in the table to a value of about 18.


A simplification of the table

At the time of writing, a draft UK syllabus (Cambridge pre-U) was expecting their students to learn the following simplification:

carbon environment chemical shift (ppm)
C-C 0 – 50
C-O 50 – 100
C=C 100 – 150
C=O 150 – 200

The C-13 NMR spectrum for but-3-en-2-oneThis is also known as 3-buten-2-one (amongst many other things!)

Here is the structure for the compound:

You can pick out all the peaks in this compound using the simplified table above.

The peak at just under 200 is due to a carbon-oxygen double bond. The two peaks at 137 and 129 are due to the carbons at either end of the carbon-carbon double bond. And the peak at 26 is the methyl group which, of course, is joined to the rest of the molecule by a carbon-carbon single bond.

If you want to use the more accurate table, you have to put a bit more thought into it – and, in particular, worry about the values which don’t always exactly match those in the table!

The carbon-oxygen double bond in the peak for the ketone group has a slightly lower value than the table suggests for a ketone. There is an interaction between the carbon-oxygen and carbon-carbon double bonds in the molecule which affects the value slightly. This isn’t something which we need to look at in detail for the purposes of this topic.

You must be prepared to find small discrepancies of this sort in more complicated molecules – but don’t worry about this for exam purposes at this level. Your examiners should give you shift values which exactly match the compound you are given.

The two peaks for the carbons in the carbon-carbon double bond are exactly where they would be expected to be. Notice that they aren’t in exactly the same environment, and so don’t have the same shift values. The one closer to the carbon-oxygen double bond has the larger value.

And the methyl group on the end has exactly the sort of value you would expect for one attached to C=O. The table gives a range of 20 – 30, and that’s where it is.

One final important thing to notice. There are four carbons in the molecule and four peaks because they are all in different environments. But they aren’t all the same height. In C-13 NMR, you can’t draw any simple conclusions from the heights of the various peaks.


The C-13 NMR spectrum for 1-methylethyl propanoate

1-methylethyl propanoate is also known as isopropyl propanoate or isopropyl propionate.

Here is the structure for 1-methylethyl propanoate:

Two simple peaks

There are two very simple peaks in the spectrum which could be identified easily from the second table above.

The peak at 174 is due to a carbon in a carbon-oxygen double bond. (Looking at the more detailed table, this peak is due to the carbon in a carbon-oxygen double bond in an acid or ester.)

The peak at 67 is due to a different carbon singly bonded to an oxygen. Those two peaks are therefore due to:

If you look back at the more detailed table of chemical shifts, you will find that a carbon singly bonded to an oxygen has a range of 50 – 65. 67 is, of course, a little bit higher than that.


As before, you must expect these small differences. No table can account for all the fine differences in environment of a carbon in a molecule. Different tables will quote slightly different ranges. At this level, you can just ignore that problem!

Before we go on to look at the other peaks, notice the heights of these two peaks we’ve been talking about. They are both due to a single carbon atom in the molecule, and yet they have different heights. Again, you can’t read any reliable information directly from peak heights in these spectra.


The three right-hand peaks

From the simplified table, all you can say is that these are due to carbons attached to other carbon atoms by single bonds. But because there are three peaks, the carbons must be in three different environments.

The more detailed table is more helpful.

Here are the structure and the spectrum again:

The easiest peak to sort out is the one at 28. If you look back at the table, that could well be a carbon attached to a carbon-oxygen double bond. The table quotes the group as CH3CO-, but replacing one of the hydrogens by a simple CH3 group won’t make much difference to the shift value.

The right-hand peak is also fairly easy. This is the left-hand methyl group in the molecule. It is attached to an admittedly complicated R group (the rest of the molecule). It is the bottom value given in the detailed table.

The tall peak at 22 must be due to the two methyl groups at the right-hand end of the molecule – because that’s all that’s left. These combine to give a single peak because they are both in exactlythe same environment.

If you are looking at the detailed table, you need to think very carefully which of the environments you should be looking at. Without thinking, it is tempting to go for the R2CH2 with peaks in the 16 – 25 region. But you would be wrong!

The carbons we are interested in are the ones in the methyl group, not in the R groups. These carbons are again in the environment: RCH3. The R is the rest of the molecule.

The table says that these should have peaks in the range 10 – 15, but our peak is a bit higher. This is because of the presence of the nearby oxygen atom. Its electronegativity is pulling electrons away from the methyl groups – and, as we’ve seen above, this tends to increase the chemical shift slightly.

Once again, don’t worry about the discrepancies. In an exam, perhaps your examiners will just want you to have learnt the simple table above – in which case, they can’t expect you to work out which peak is which in a complicated spectrum of this sort. Or they will give you tables of chemical shifts – in which case, they will give you values which match the peaks in the spectra.

Remember that you are only doing an introduction to C-13 NMR at this level. It isn’t going to be that hard in an exam!

Working out structures from C-13 NMR spectra

So far, we’ve just been trying to see the relationship between carbons in particular environments in a molecule and the spectrum produced. We’ve had all the information necessary. Now let’s make it a little more difficult – but we’ll work from much easier examples!

In each example, try to work it out for yourself before you read the explanation.


Example 1

How could you tell from just a quick look at a C-13 NMR spectrum (and without worrying about chemical shifts) whether you had propanone or propanal (assuming those were the only options)?

Because these are isomers, each has the same number of carbon atoms, but there is a difference between the environments of the carbons which will make a big impact on the spectra.

In propanone, the two carbons in the methyl groups are in exactly the same environment, and so will produce only a single peak. That means that the propanone spectrum will have only 2 peaks – one for the methyl groups and one for the carbon in the C=O group.

However, in propanal, all the carbons are in completely different environments, and the spectrum will have three peaks.


Example 2

Thare are four alcohols with the molecular formula C4H10O.

Which one produced the C-13 NMR spectrum below?

You can do this perfectly well without referring to chemical shift tables at all.

In the spectrum there are a total of three peaks – that means that there are only three different environments for the carbons, despite there being four carbon atoms.

In A and B, there are four totally different environments. Both of these would produce four peaks.

In D, there are only two different environments – all the methyl groups are exactly equivalent. D would only produce two peaks.

That leaves C. Two of the methyl groups are in exactly the same environment – attached to the rest of the molecule in exactly the same way. They would only produce one peak. With the other two carbon atoms, that would make a total of three. The alcohol is C.


Example 3

This follows on from Example 2, and also involves an isomer of C4H10O but which isn’t an alcohol. Its C-13 NMR spectrum is below. Work out what its structure is.

Because we don’t know what sort of structure we are looking at, this time it would be a good idea to look at the shift values. The approximations are perfectly good, and we will work from this table:

carbon environment chemical shift (ppm)
C-C 0 – 50
C-O 50 – 100
C=C 100 – 150
C=O 150 – 200

There is a peak for carbon(s) in a carbon-oxygen single bond and one for carbon(s) in a carbon-carbon single bond. That would be consistent with C-C-O in the structure.

It isn’t an alcohol (you are told that in the question), and so there must be another carbon on the right-hand side of the oxygen in the structure in the last paragraph.

The molecular formula is C4H10O, and there are only two peaks. The only solution to that is to have two identical ethyl groups either side of the oxygen.

The compound is ethoxyethane (diethyl ether), CH3CH2OCH2CH3.


Example 4

Using the simplified table of chemical shifts above, work out the structure of the compound with the following C-13 NMR spectrum. Its molecular formula is C4H6O2.

Let’s sort out what we’ve got.

  • There are four peaks and four carbons. No two carbons are in exactly the same environment.
  • The peak at just over 50 must be a carbon attached to an oxygen by a single bond.
  • The two peaks around 130 must be the two carbons at either end of a carbon-carbon double bond.
  • The peak at just less than 170 is the carbon in a carbon-oxygen double bond.

Putting this together is a matter of playing around with the structures until you have come up with something reasonable. But you can’t be sure that you have got the right structure using this simplified table.

In this particular case, the spectrum was for the compound:

If you refer back to the more accurate table of chemical shifts towards the top of the page, you will get some better confirmation of this. The relatively low value of the carbon-oxygen double bond peak suggests an ester or acid rather than an aldehyde or ketone.

It can’t be an acid because there has to be a carbon attached to an oxygen by a single bond somewhere – apart from the one in the -COOH group. We’ve already accounted for that carbon atom from the peak at about 170. If it was an acid, you would already have used up both oxygens in the structure in the -COOH group.

Without this information, though, you could probably come up with reasonable alternative structures. If you were working from the simplified table in an exam, your examiners would have to allow any valid alternatives.

Figure 3: 1H and 13C NMR spectra of the abcc-monomer and the ABCC-sequence-regulated copolymer.

1H and 13C NMR spectra of the abcc-monomer and the ABCC-sequence-regulated copolymer.

(a1H and 13C NMR spectra of 7. (b1H and 13C NMR spectra of poly(7) obtained with CuCl/N,N,N′,N″,N″-pentamethyldiethylenetriamine (PMDETA) ([CuCl]0=200 mM; [PMDETA]0=800 mM) in bulk at 100 °C. All spectra were measured in CDCl3 at room temperature The brackets for repeating units in poly(7) are positioned differently from those in Figs. 1 and 4 so that the signals originating from the terminal groups can be assigned to the chemical structures.


Share

Structural and physicochemical aspects of hydrochlorothiazide co-crystals

 Uncategorized  Comments Off on Structural and physicochemical aspects of hydrochlorothiazide co-crystals
Jul 172014
 

Structural and physicochemical aspects of hydrochlorothiazide co-crystals

CrystEngComm, 2014, 16,6996-7003
DOI: 10.1039/C4CE00666F, Paper
*

Corresponding authors

aPharmaceutical Analytical & Solid-State Chemistry Research Center, Shanghai Institute of Materia Medica, Chinese Academy of Sciences, Shanghai 201203, China

The drug-drug co-crystal of hydrochlorothiazide with pyrazinamide is a potential candidate for development of hydrochlorothiazide formulations for combinational therapy.

Crystal engineering principles were employed in designing new co-crystals of hydrochlorothiazide (HCT). A variety of potential co-crystal formers were initially identified in a search of the Cambridge Structural Database with complementary hydrogen-bonding functionalities. Subsequent co-crystallization screening monitored by powder X-ray diffraction led to the discovery of new crystalline phases of HCT with pyrazinamide (1), 4,4′-bipyridine (2), 1,2-bis(4-pyridyl)ethane (3), and trans-1,2-bis(4-pyridyl)ethylene (4). All of the resulting co-crystals were thoroughly characterized by X-ray diffraction, FT-IR and Raman spectroscopy, and thermal analysis. Noticeably, the co-crystal 1 involves the formation of drug–drug co-crystals of HCT and pyrazinamide, which makes it a potential candidate for development of HCT formulations for combinational therapy.
Share

Anthony crasto’s blog New drug approvals touches 3 lakh views…….Helping millions

 Uncategorized  Comments Off on Anthony crasto’s blog New drug approvals touches 3 lakh views…….Helping millions
Jul 162014
 

link is http://newdrugapprovals.org/


All about Drugs, live, by DR ANTHONY MELVIN CRASTO, Worlddrugtracker, Helping millions, 7 million hits on google, pushing boundaries, one lakh plus connections worldwide, 3 lakh plus VIEWS on this blog in 193 countries


ANTHONY MELVIN CRASTO

THANKS AND REGARD’S
DR ANTHONY MELVIN CRASTO Ph.D

amcrasto@gmail.com

MOBILE-+91 9323115463
GLENMARK SCIENTIST ,  INDIA
web link
アンソニー     安东尼   Энтони    안토니     أنتوني
blogs are
 

 MY CHINA, VIETNAM  AND JAPAN BLOGS

http://me.zing.vn/u/amcrasto

ICELAND, RUSSIA, ARAB

BOBRDOBRBLAND ICELAND100zakladokadfty

GROUPS

you can post articles and will be administered by me on the google group which is very popular across the world

OPD GROUPSPACESSCOOP OCIorganic-process-development GOOGLE, TVINXMENDELEY WDTSCIPEOPLE OPD,EPERNICUS OPDSYNTHETIC ORGANIC CHEMISTRYLinkedIn group, DIIGO OPDLINKEDIN OPDWDT LINKEDINWDTI ZING

shark


Share this

Share

How to design drugs that could target particular nerve cells?

 Uncategorized  Comments Off on How to design drugs that could target particular nerve cells?
Jul 162014
 

The future of drug design lies in developing therapies that can target specific cellular processes without causing adverse reactions in other areas of the nervous system. Scientists at the Universities of Bristol and Liège in Belgium have discovered how to design drugs to target specific areas of the brain. The research, led by Professor Neil Marrion at Bristol’s School of Physiology and Pharmacology and published in this week’s Proceedings of National Academy of Sciences USA (PNAS), will enable the design of more effective drug compounds to enhance nerve activity in specific nerves. –

http://www.pharmaceuticalinfo.net/2011/12/how-to-design-drugs-that-could-target.html#.U8ZezPQW09t

See more at: http://www.pharmaceuticalinfo.net/2011/12/how-to-design-drugs-that-could-target.html#.U8ZezPQW09t

Share

Market Opportunities Report on Poorly Soluble and Poorly Permeable Drugs

 Uncategorized  Comments Off on Market Opportunities Report on Poorly Soluble and Poorly Permeable Drugs
Jul 162014
 
AZoNano - The A to Z of Nanotechnology
Published on July 14, 2014 at 6:04 AM IN AZANO

Poor bioavailability is a major reason for compounds to fail in preclinical development. Technology Catalysts International (TCI), a leading global pharmaceutical consulting firm, has compiled and analyzed technical and market information pertaining to the delivery of poorly water soluble or poorly permeable pharmaceutical compounds.

http://www.azonano.com/news.aspx?newsID=30615

To download a complimentary excerpt of this report, go to:

http://www.technology-catalysts.com/pdf/psd7_bro.pdf

Source: http://www.technology-catalysts.com/

Share

Top 10 Pharma – products in the pipeline

 Uncategorized  Comments Off on Top 10 Pharma – products in the pipeline
Jul 142014
 

Top 10 Pharma – products in the pipeline

READ AT

http://latampharmara.com/2013/12/15/top-10-pharma-products-on-the-pipeline/

CLICK LINK ABOVE


ANTHONY MELVIN CRASTO

THANKS AND REGARD’S
DR ANTHONY MELVIN CRASTO Ph.D

amcrasto@gmail.com

MOBILE-+91 9323115463
GLENMARK SCIENTIST ,  INDIA
web link
アンソニー     安东尼   Энтони    안토니     أنتوني
blogs are
 

 MY CHINA, VIETNAM  AND JAPAN BLOGS

http://me.zing.vn/u/amcrasto

ICELAND, RUSSIA, ARAB

BOBRDOBRBLAND ICELAND100zakladokadfty

GROUPS

you can post articles and will be administered by me on the google group which is very popular across the world

OPD GROUPSPACESSCOOP OCIorganic-process-development GOOGLE, TVINX, MENDELEY WDT, SCIPEOPLE OPD, EPERNICUS OPDSYNTHETIC ORGANIC CHEMISTRYLinkedIn group, DIIGO OPD, LINKEDIN OPD, WDT LINKEDIN, WDTI ZING

shark


Share

Examples of 1H NMR Spectra

 Uncategorized  Comments Off on Examples of 1H NMR Spectra
Jul 112014


These several pages contain some 1H nmr spectra , with annotations and comments. Try to understand why each spectrum looks as it does, including the approximate chemical shifts and the splitting patterns.

Figure of chemical shifts for different types of H


upfield and downfield regions of nmr spectra


The time has arrived to look at a few H-NMR spectra…..

H-NMR spectrum of methyl bromideH-NMR spectrun of 2-propanone
H-NMR spectra of methyl ethanoate

Coupling in H-NMR

So far the H-NMR spectra that we have looked at have all had different types of protons that are seen as singlets in the spectra.  This is not the normal case…. spectra usually have peaks that appear as groups of peaks due to coupling with neighboring protons, for example, see the spectra of 1,1-dichloroethane shown below.

H-NMR spectrum of 1,1-dichloroethane
H-NMR spectrun of 1-bromopropane
H-NMR spectrum of ethyl bromide

Compound, CH3X
CH3F
CH3OH
CH3Cl
CH3Br
CH3I
CH4
(CH3)4Si
X
F
O
Cl
Br
I
H
Si
Electronegativity of X
4.0
3.5
3.1
2.8
2.5
2.1
1.8
Chemical shift, d / ppm
4.26
3.4
3.05
2.68
2.16
0.23
0


H-NMR spectrum of ethyl bromide


In this spectrum the two methyls labeled (a) are homotopic, as are the two methylenes labeled (b).


  • The three Hs within each methyl are homotopic, and the two Hs within each methylene are enantiotopic.
  • Hence we get single absorptions for these groups, displaying the typical ethyl pattern of methyl triplet and CH2 quartet.
  • Note the numerical values for the integration shown under the chemical shift scale, which fit the 3 : 2 ratio of CH3 to CH2.

The two CH2 groups labeled (c) are homotopic (enantiotopic within the group) and therefore have the same chemical shift.


  • They are split to a triplet by the CH2 at (d).

The two Hs of (d) are enantiotopic and have the same chemical shift.


  • With a total of four equivalent neighbors (both (c) groups), (d) should be a quintet. The enlarged view shows this clearly.
  • The apparent small additional couplings seen are probably artifacts. The integration values fit the 2 : 1 ratio of (c) to (d).

Part of the use we make of nmr spectra is simple pattern recognition. An ethyl is always triplet + quartet, although the separation between the two groups will vary according to the rest of the structure. A chain of three CH2 with no other neighbors is always triplet + quintet, again with variation in the separation on the chemical shift axis.


The proton NMR spectrum for aminorex and its structural assignments are provided in Fig. 2. Unlike the spectrum of methylaminorex, no upfield (<3 δ) absorbances characteristic of a methyl group occur in the 1H NMR spectrum of the  sample.

The obtained spectrum is indicative of the assigned structure of aminorex, with the phenyl group appearing at 7.35 δ, a benzylic methine triplet at 5.46 δ, the exchangeable amino group at 5.2 δ, and the nonequivalent hydrogens of the methylene group β to the phenyl ring at 4.13 and 3.65δ. The


The next spectrum illustrates several spectral features, including the unusual chemical shift of the aromatic hydrogen and an aldehyde H, and another characteristic alkyl splitting pattern.

The homotopic methyls at (a) and the unique H at (b) form an isopropyl (1-methylethyl) group, with an extremely characteristic pattern: doublet + septet, 6 : 1 integration ratio. As is often the case, we must expand the septet region to be able to see all seven peaks; if such an expansion is not available, the absorption may be referred to as a “multiplet”, meaning “There’s a bunch of lines there, but I can’t quite count ’em!”

The pattern of the hydrogens on the benzene ring, (c) and (d), is also typical – typical for a 1,4-disubstituted benzene (para-disubstituted) with groups that differ distinctly, so that the hydrogens next to one substituent are in a significantly different environment than those next to the other. The two widely separated doublets (one neighbor) show clearly in the expansion.

The benzene chemical shift arises from an induced circulation of electrons:


The aldehyde H in R-CHO is usually found shifted downfield to the neighborhood of 9.5 ppm by an induced circulation of the p-electrons of the C=O. In Ar-CHO the additional circulation of the p-electrons of the benzene ring produces a further shift, to the vicinity of 10 ppm.

The next spectrum illustrates accidental equivalence of chemical shift among benzene hydrogens, as well as splitting in another type of alkyl group.

The three groups, (a), (b), and (c) produce spectral features typical of propyl groups. A 3H methyl triplet for (a), split by the neighboring CH2 (b) is straightforward. Likewise, a 2H triplet for (c), also split by (b). The (b) CH2 actually has two differentgroups of neighbors. Nonetheless, because rotation within the alkyl group averages all the coupling constants to the typical alkyl 7.5 – 8 Hz, we see a sextet for (b), as if the CH2 and CH3 neighbors were a single CH5 group. Such behavior is quite common is acyclic structures.

The other feature of note is that although the benzene ring actually bears three different kinds of H (e, f, and g), the CH2substituent on the ring is not electronegative enough to induce a significant chemical shift difference between the hydrogens near it and those further away. Thus the five hydrogens accidentally have the same chemical shift in this spectrometer. An instrument with a more powerful magnet would spread out the spectrum still further, and show us the three expected absorptions.

This example illustrates diastereotopic hydrogens and the construction of a splitting tree to describe coupling to two different hydrogens.

In this spectrum, the diastereotopic alkene hydrogens, labeled Ha and Hb, have distinctly different chemical shifts. Hb is downfield, mixed in among the absorptions for the benzene hydrogens (b), (c), and (d). [Can you draw a resonance structure that explains why Hb is downfield from Ha?] Ha is coupled to both Hb and to the aldehyde H (a), which can be seen as a doublet near 10 ppm.

Since the two hydrogens to which Ha is coupled are different, we must apply the couplings separately in order to predict the observed splitting pattern. This is shown in the sketch below:

The coupling to Hbtrans- across a double bond, is quite large, and splits the Ha absorption into a doublet. Then the smaller coupling to (a) splits each half of the doublet again, giving a quartet. The kind of diagram shown here is called a “splitting tree”, and can be constructed for any case in which a group of nuclei is coupled to two distinctly different neighbors.


Let’s construct the splitting tree for this one:


Another example of an H NMR is shown below.

Typical H-nmr spectrum
Based on the outline given above the four sets of information we get are:

5 basic types of H present in the ratio of 5 : 2 : 2 : 2 : 3.
These are seen as a 5H “singlet” (ArH), two 2H triplets, a 2H quartet and a 3H triplet. Each triplet tells us that there are 2H in the adjacent position, and a quartet tells us that there are 3H adjacent.
(Think of it as the lines you see, L = n + 1, where n = number of equivalent adjacent H)
This tells us we that the peaks at 4.4 and 2.8 ppm must be connected as a CH2CH2 unit.
The peaks at 2.1 and 0.9 ppm as a CH2CH3 unit. Using the chemical shift charts, the H can be assigned to the peaks as below:


7.2ppm (5H) = ArH ;
4.4ppm (2H) = CH2O;
2.8ppm (2H) = Ar-CH2;
2.1ppm (2H) = O=CCH2CHand
0.9ppm (3H) = CH2CH3
more examples
In the 1H-NMR spectrum of 2-ethylphenol, the CH3 signal is a triplet, the CH2 signal is a quartet, the OH signal is a singlet, and the benzene ring protons signal is a multiplet.

Some Typical 1H Chemical Shifts (δ values) in Selected Solvents
Solvent
Compound
CDCl3 C6D6 CD3COCD3 CD3SOCD3 CD3C≡N D2O
(CH3)3C–O–CH3
C–CH3
O–CH3
1.19 
3.22
1.07 
3.04
1.13 
3.13
 1.11
3.03
1.14 
3.13
1.21 
3.22
(CH3)3C–O–H
C–CH3
O–H
1.26 
1.65
1.05 
1.55
1.18 
3.10
1.11 
4.19
1.16 
2.18

C6H5CH3
CH3
C6H5
2.36 
7.15-7.20
2.11 
7.00-7.10
2.32 
7.10-7.20
2.30 
7.10-7.15
2.33 
7.15-7.30

(CH3)2C=O 2.17 1.55 2.09 2.09 2.08 2.22


The splitting pattern of a given nucleus (or set of equivalent nuclei) can be predicted by the n+1 rule, where n is the number of neighboring spin-coupled nuclei with the same (or very similar) Js. If there are 2 neighboring, spin-coupled, nuclei the observed signal is a triplet ( 2+1=3 ); if there are three spin-coupled neighbors the signal is a quartet ( 3+1=4 ). In all cases the central line(s) of the splitting pattern are stronger than those on the periphery. The intensity ratio of these lines is given by the numbers in Pascal’s triangle. Thus a doublet has 1:1 or equal intensities, a triplet has an intensity ratio of 1:2:1, a quartet 1:3:3:1 etc. To see how the numbers in Pascal’s triangle are related to the Fibonacci series click on the diagram.

If a given nucleus is spin-coupled to two or more sets of neighboring nuclei by different J values, the n+1 rule does not predict the entire splitting pattern. Instead, the splitting due to one J set is added to that expected from the other J sets. Bear in mind that there may be fortuitous coincidence of some lines if a smaller J is a factor of a larger J.


Magnitude of Some Typical Coupling Constants

<

R-O-H   +   D2O      R-O-D   +   D-O-H


Interpreting a H-NMR Spectrum

The NMR Spectrometer at  is graded at 300 MHz.  This means the Larmor frequency of a single, unaltered hydrogen nucleus and its electron with \sigma=0, is 300 MHz.  The magnetogyric ratio \gamma of a hydrogen nucleus is 267.513*10^{6}\frac{rad}{T•s} .  A quick calculation using:

(1) \begin{equation*} \nu_{0}=\frac{\gamma B_{0}(1-\sigma)}{2\pi} \end{equation*}

shows the magnetic field strength of the NMR is roughly 7.046 T.

Using this information and the ^{1}
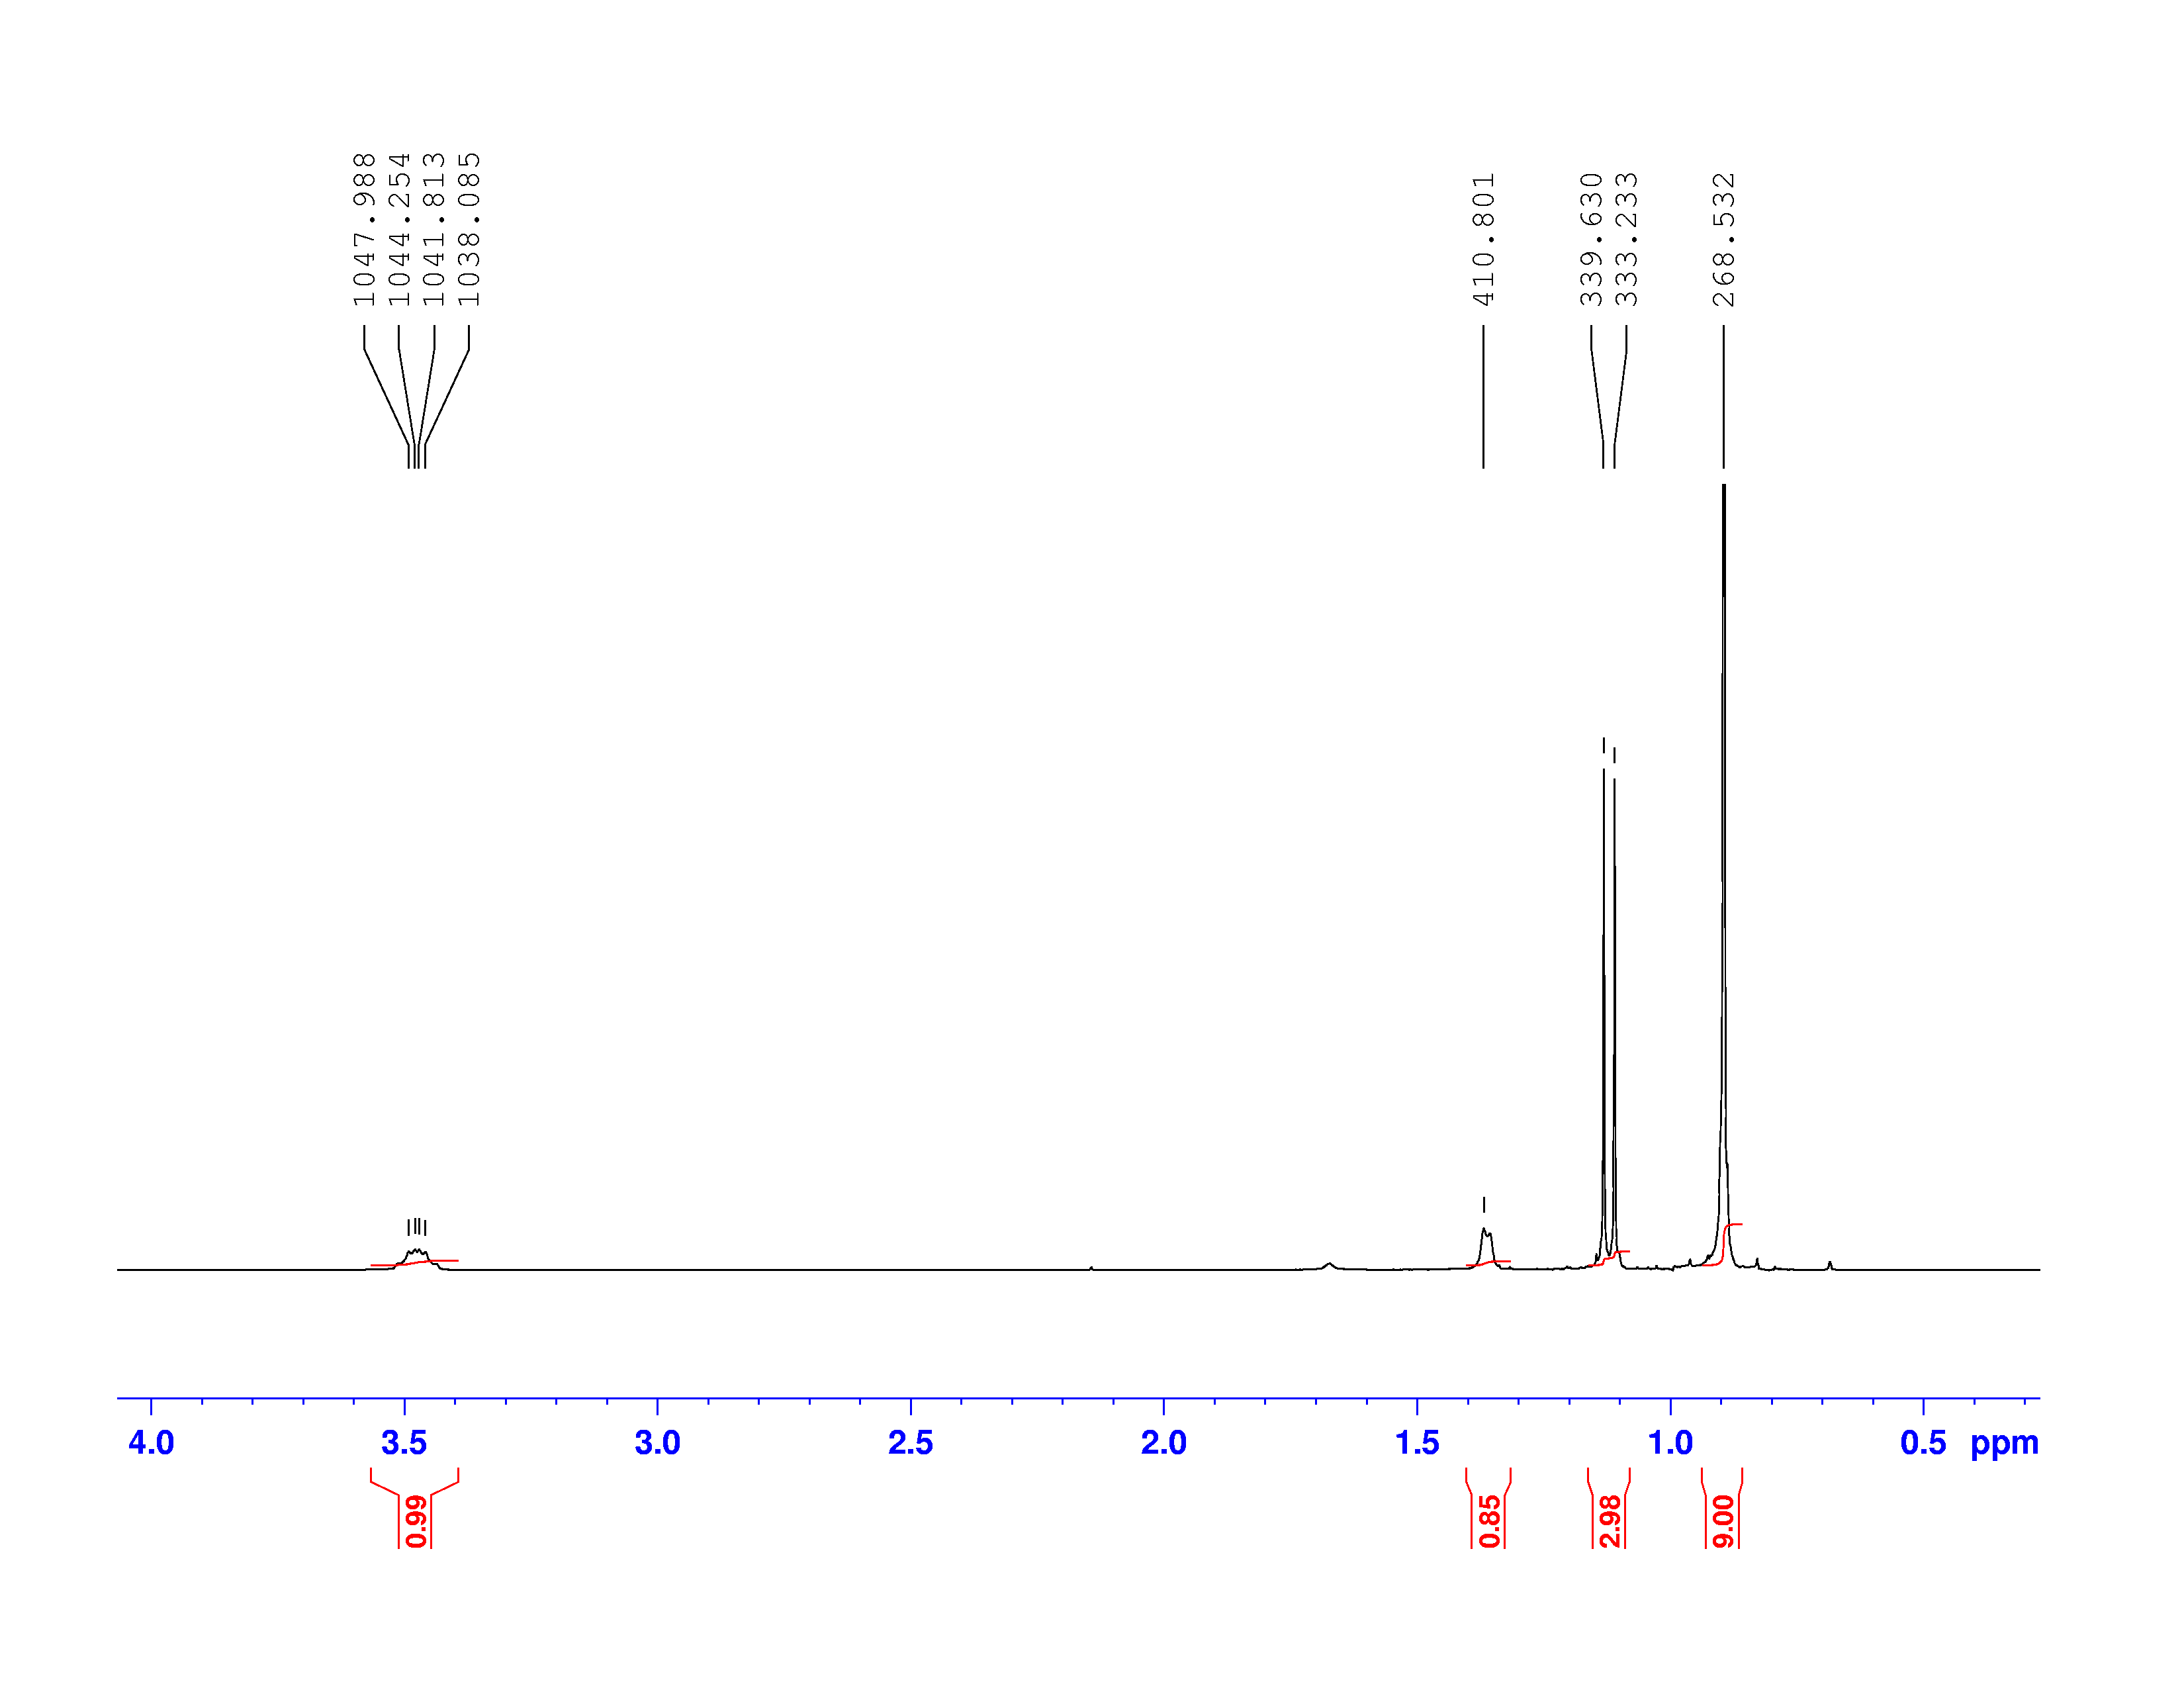
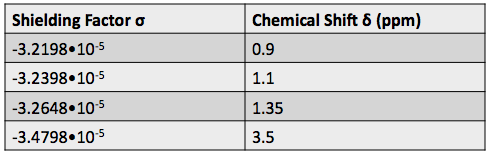
H-NMR spectrum, we can calculate shielding factors for each type of hydrogen nucleus in 3,3-dimethyl-2-butanol, and determine what each spectrum peak actually means.

Let’s start with the peak farthest to the right on the spectrum.  It is a single peak, called a singlet, that represents nine hydrogens, and is centered at approximately 0.9 ppm on the x-axis.  The ppm scale measures how much the Larmor frequency of hydrogen is changed by the effective magnetic field.  The Larmor frequency of the hydrogens represented by the first peak was increased by 0.9 ppm of the initial 300 MHz frequency.  A calculation of these hydrogens’ shielding factor follows using equation (1):

300 MHz+(\frac{0.9 ppm}{10^{6}}*300 MHz)=\frac{267.513*10^{6}\frac{rad}{T•s}*7.046T*(1-\sigma)}{2\pi}

300000270 Hz=299990611 Hz(1-\sigma)

\sigma=-3.2198*10^{-5}

Shielding factors tend to be small for most hydrogen nuclei.  A table of chemical shift and shielding factor values for each hydrogen nucleus in 3,3-dimethyl-2-butanol is below.

A more negative shielding factor corresponds with a lower electron density around the hydrogen nucleus and with a larger effective magnetic field influencing the nucleus.  The presence of very electronegative atoms, like oxygen, near the hydrogen causes increased chemical shifts like the 3.5 ppm shift in the table.

One peak in the spectrum above is split into two peaks centered around the chemical shift  1.1 ppm.  This splitting occurs because there is another magnetically active hydrogen nucleus nearby in the molecule.  The rule for split peaks is: the number of nearby hydrogens is given by n-1, where n is the number of peaks.  The definition of “nearby” is usually 1 carbon atom over in the molecule from the one the original hydrogen is attached to.

The figure below shows the structure of 3,3-dimethyl-2-butanol with the hydrogens labeled with their corresponding chemical shifts.  This will be the first step in reconstructing the molecule from the NMR data.


ANTHONY MELVIN CRASTO

THANKS AND REGARD’S
DR ANTHONY MELVIN CRASTO Ph.D

amcrasto@gmail.com

MOBILE-+91 9323115463
GLENMARK SCIENTIST ,  INDIA
web link
アンソニー     安东尼   Энтони    안토니     أنتوني
blogs are
 

 MY CHINA, VIETNAM  AND JAPAN BLOGS

http://me.zing.vn/u/amcrasto

ICELAND, RUSSIA, ARAB

BOBRDOBRBLAND ICELAND100zakladokadfty

GROUPS

you can post articles and will be administered by me on the google group which is very popular across the world

OPD GROUPSPACESSCOOP OCIorganic-process-development GOOGLE, TVINX,

shark


Share

China struggles to speed up drug reviews

 Uncategorized  Comments Off on China struggles to speed up drug reviews
Jul 102014
 

pharmacist with drug package

China wants to prioritise new drugs and certain generics over more routine requests © Shutterstock

http://www.rsc.org/chemistryworld/2014/07/china-struggles-speed-drug-reviews

In an effort to accelerate slow regulatory drug reviews, the China Food and Drug Administration (CFDA) is attempting to outsource some reviewing processes and introducing fast-track priority reviews for selected generic drugs.

Yin Li, deputy head of the CFDA, told the annual conference of medical information held in Beijing in May that the CFDA is planning to commission third-party organisations to share the overloaded reviewing responsibilities. In parallel, the agency is also revising regulations for drug registration, such that priority reviews can be given to generics with critical clinical value as well as brand new drugs.http://www.rsc.org/chemistryworld/2014/07/china-struggles-speed-drug-reviews


Share
Follow

Get every new post on this blog delivered to your Inbox.

Join other followers: