AUTHOR OF THIS BLOG

DR ANTHONY MELVIN CRASTO, WORLDDRUGTRACKER

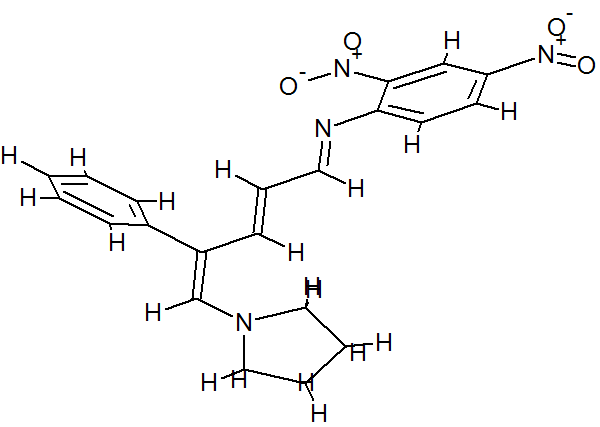
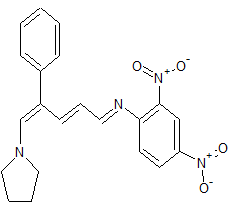
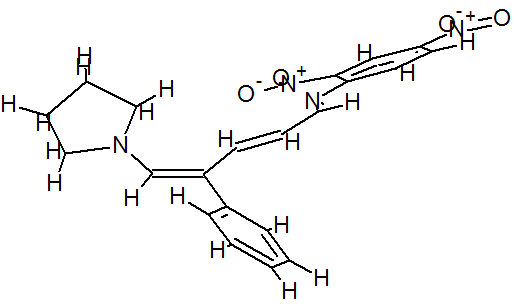
Synthesis of (E)-2,4-Dinitro-N-((2E,4E)-4-phenyl-5-(pyrrolidin-1-yl)penta-2,4-dienylidene)aniline

 spectroscopy, SYNTHESIS, Uncategorized  Comments Off on Synthesis of (E)-2,4-Dinitro-N-((2E,4E)-4-phenyl-5-(pyrrolidin-1-yl)penta-2,4-dienylidene)aniline
Dec 212016
 

str1

Cas 1204588-48-6
MF C21 H20 N4 O4
MW 392.41
Benzenamine, 2,​4-​dinitro-​N-​[(2E,​4E)​-​4-​phenyl-​5-​(1-​pyrrolidinyl)​-​2,​4-​pentadien-​1-​ylidene]​-​, [N(E)​]​-
(E)-2,4-Dinitro-N-((2E,4E)-4-phenyl-5-(pyrrolidin-1-yl)penta-2,4-dienylidene)aniline
str1


Molbank 2009, 2009(3), M604; doi:10.3390/M604

Synthesis of (E)-2,4-Dinitro-N-((2E,4E)-4-phenyl-5-(pyrrolidin-1-yl)penta-2,4-dienylidene)aniline
Nosratollah Mahmoodi 1,*, Manuchehr Mamaghani 1, Ali Ghanadzadeh 2, Majid Arvand 3 and Mostafa Fesanghari 1
1Laboratory of Organic Chemistry, Faculty of Science, University of Guilan, P.O.Box 1914, Rasht, Iran,
2Departments of Physical Chemistry, Faculty of Science, University of Guilan, P.O.Box 1914, Rasht, Iran
3Departments of Analytical Chemistry, Faculty of Science, University of Guilan, P.O.Box 1914, Rasht, Iran
*Author to whom correspondence should be addressed
mahmoodi@guilan.ac.ir, m-chem41@guilan.ac.ir, aggilani@guilan.ac.ir, arvand@guilan.ac.ir, nosmahmoodi@gmail.com

Abstract:

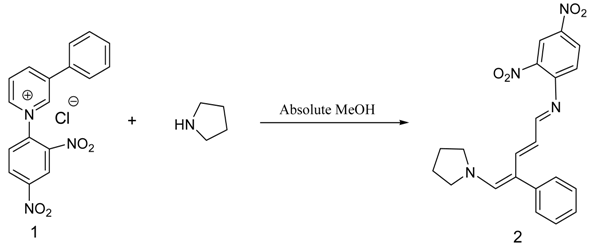
(E)-2,4-Dinitro-N-((2E,4E)-4-phenyl-5-(pyrrolidin-1-yl)penta-2,4-dienylidene) aniline dye was prepared in one pot by reaction of premade N-2,4-dinitrophenyl-3-phenylpyridinium chloride (DNPPC) and pyrrolidine in absolute MeOH.
Keywords:

N-2,4-dinitrophenyl-3-phenylpyridinium chloride (DNPPC); photochromic; pyridinium salt

N-2,4-Dinitrophenyl-3-phenylpyridinium chloride (DNPPC) 1 was prepared according to the literature method [1,2,3,4,5,6,7]. Recently, we became interested in the synthesis of photochromic compounds [8,9,10]. The UV-Vis spectra under irradiation of UV light of dye 2 indicate photochromic properties for this molecule. The salt 1 was premade and typically isolated and purified by recrystallization and characterized. To a solution of 1-chloro-2,4-dinitrobenzene (1.42 g, 7.01 mmol) in acetone (10 mL) was added 3-phenylpyridine (1.0 mL, 6.97 mmol). The reaction was heated at reflux for 48 h. The solvent was removed under reduced pressure and the red residue was stirred in hexanes. The precipitated product was collected by vacuum filtration to afford pure pyridinium salt 1 as a reddish brown solid (2.23 g, 6.25 mmol, 90%). 1H NMR (CDCl3, 500 MHz): δ (ppm) 9.9 (s, 1H), 9.4 (d, J = 6.0 Hz, 1H), 9.3 (d, J = 8.3 Hz, 1H), 9.2 (d, J = 2.2 Hz, 1H), 9.0 (dd, J = 8.7, 2.4 Hz, 1H), 8.5-8.6 (m, 2H), 8.0 (d, J = 7.3 Hz, 2H), 7.6- 7.7 (m, 3H); 13C NMR (CDCl3, 125 MHz): δ (ppm) 149.2, 145.6, 144.3, 144.2, 143.0, 139.2, 138.7, 132.5, 132.3, 130.6, 130.2, 129.6, 128.0, 127.6, 121.3; IR (KBr pellet) 3202, 3129, 2994, 2901, 1609 cm-1; m. p. = 182-183 °C; HRMS m/z Calcd for C17H12N3O4+ (M)+ 322.0828, found 322.0836.
Molbank 2009 m604 i001
Reaction of pyrrolidine with salt (1) leads to the opening of the pyridinium ring and formation of dye 2. This dye was prepared from reaction of salt 1 (0.5 g, 1.4 mmol) in 5 mL absolute MeOH after cooling a reaction mixture to -10oC and keeping at this temperature for 15 min. To this was added pyrrolidine (0.1 g, 1.4 mmol) in 3 mL absolute MeOH over a period of 10 min. The prepared solid was filtered, washed with CH2Cl2, dried and recrystallized from n-hexane to yield 68% (0.37 g, 0.95 mmol) of pure metallic greenish-brown 2,
m.p. = 146 oC.
IR (KBr): 3040, 2950, 1616, 1514, 1492, 1469, 1321, 1215, 1170, 1105, 956, 904, 862, 727 cm-1.
1H NMR (500 MHz, CDCl3): δ (ppm) 8.7 (d, J = 2.4 Hz, 1H) 8.3 (dd, J = 2.4, 8.84 Hz, 1H), 8.0 (s, 1H), 7.5 (d, J = 7.4 Hz, 2H), 7.4-7.5 (t, J = 7.5 Hz, 2H), 7.3-7.4 (m, 1H), 7.2 (d, J = 12.5 Hz, 1H), 7.1 (d, J = 8.9 Hz, 1H), 7.0 (d, J = 12.1 Hz, 1H), 5.4 (t, J = 12.2 Hz, 1H), 3.3 (br, 4H), 2.0 (br, 4H);
13C NMR (125 MHz, CDCl3): δ (ppm) 22.0, 55.6, 114.7, 117.4, 120.0, 124.1, 126.4, 128.7, 128,8, 129.0, 132.7, 137.1, 137.3, 142.9, 147.8, 150.2, 163.8.
Anal. Calcd for C21H20N4O4: %C = 64.28, %H = 5.14, %N = 14.28. Found: %C = 64.08, %H = 5.11, %N = 14.07.

str1


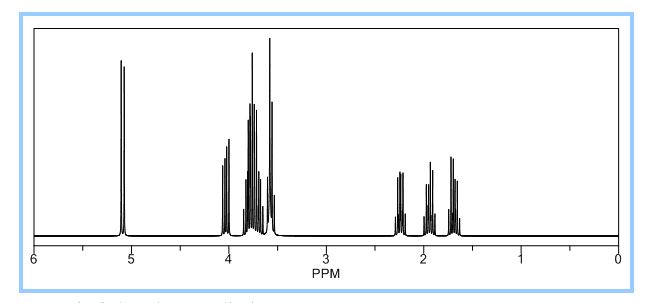
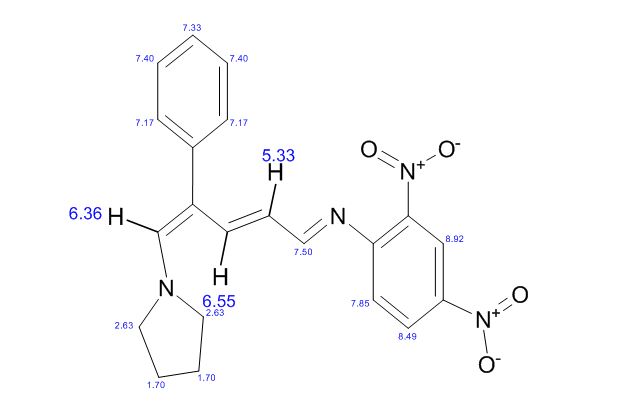
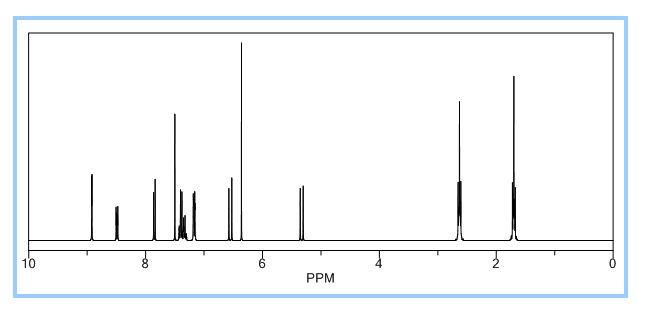
1H NMR PREDICT

str0

ACTUAL….

1H NMR (500 MHz, CDCl3): δ (ppm) 8.7 (d, J = 2.4 Hz, 1H) 8.3 (dd, J = 2.4, 8.84 Hz, 1H), 8.0 (s, 1H), 7.5 (d, J = 7.4 Hz, 2H), 7.4-7.5 (t, J = 7.5 Hz, 2H), 7.3-7.4 (m, 1H), 7.2 (d, J = 12.5 Hz, 1H), 7.1 (d, J = 8.9 Hz, 1H), 7.0 (d, J = 12.1 Hz, 1H), 5.4 (t, J = 12.2 Hz, 1H), 3.3 (br, 4H), 2.0 (br, 4H);

str0


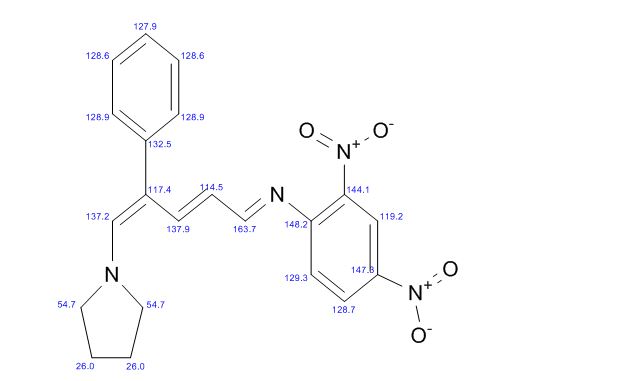
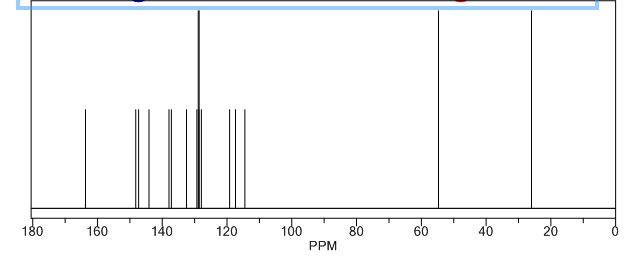
13 C NMR PREDICT


str1

ACTUAL…….13C NMR (125 MHz, CDCl3): δ (ppm) 22.0, 55.6, 114.7, 117.4, 120.0, 124.1, 126.4, 128.7, 128,8, 129.0, 132.7, 137.1, 137.3, 142.9, 147.8, 150.2, 163.8.

str3

////////////Synthesis, (E)-2,4-Dinitro-N-((2E,4E)-4-phenyl-5-(pyrrolidin-1-yl)penta-2,4-dienylidene)aniline

[O-][N+](=O)c3ccc(\N=C\C=C\C(=C/N1CCCC1)c2ccccc2)c([N+]([O-])=O)c3

Share

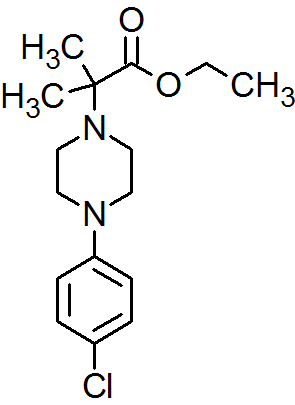
Synthesis of 2-[4-(4-Chlorophenyl)piperazin-1-yl]-2-methylpropanoic Acid Ethyl Ester

 spectroscopy, SYNTHESIS, Uncategorized  Comments Off on Synthesis of 2-[4-(4-Chlorophenyl)piperazin-1-yl]-2-methylpropanoic Acid Ethyl Ester
Dec 202016
 
str1
2-[4-(4-Chlorophenyl)piperazin-1-yl]-2-methylpropanoic Acid Ethyl Ester
1-Piperazineacetic acid, 4-(4-chlorophenyl)-α,α-dimethyl-, ethyl ester
2-[4-(4-Chlorophényl)-1-pipérazinyl]-2-méthylpropanoate d‘éthyle
Ethyl 2-[4-(4-chlorophenyl)-1-piperazinyl]-2-methylpropanoate
Ethyl-2-[4-(4-chlorphenyl)-1-piperazinyl]-2-methylpropanoat
1206769-44-9
2-[4-(4-Chlorophenyl)piperazin-1-yl]-2-methylpropanoic Acid Ethyl Ester (en)
AGN-PC-0JIRMK
AKOS016034964
ethyl 2-[4-(4-chlorophenyl)piperazin-1-yl]-2-methylpropanoate
MWt310.819
MFC16H23ClN2O2
Image result for MOM CAN TEACH YOU NMRNMR IS EASY
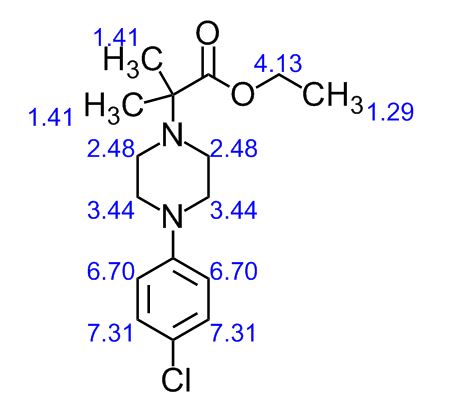
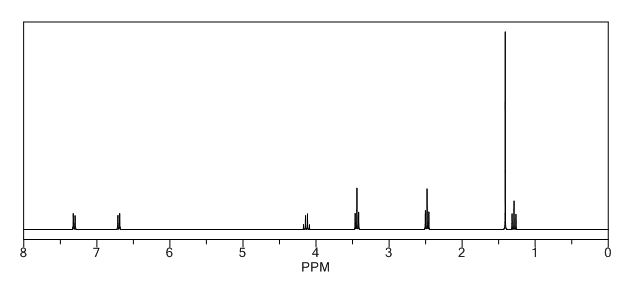
1H NMR PREDICT
 str0
ACTUAL VALUES……..1H NMR (400 MHz, CDCl3): δ ppm 1.27 (t, 3H, J = 7.2 Hz, -CH2-CH3), 1.35 (s, 6H, 2 x CH3), 2.74-2.76 (m, 4H, J = 4.8 Hz, -CH2-N-CH2-), 3.14-3.17 (m, 4H, J = 4.8 Hz, -CH2-N-CH2-), 4.20 (q, 2H, J = 7.2 Hz, -CH2-CH3), 6.81-6.83 (d, 2H, J = 6.8 Hz, phenyl protons), 7.17-7.20 (d, 2H, J = 6.8 Hz, phenyl protons).
str1
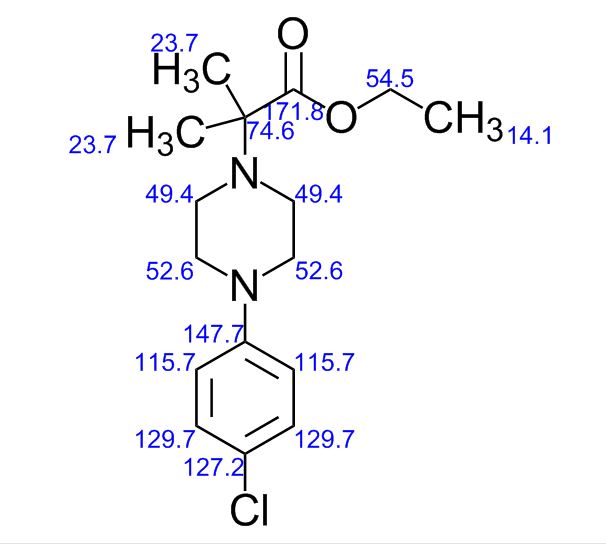
13C NMR PREDICT
str2
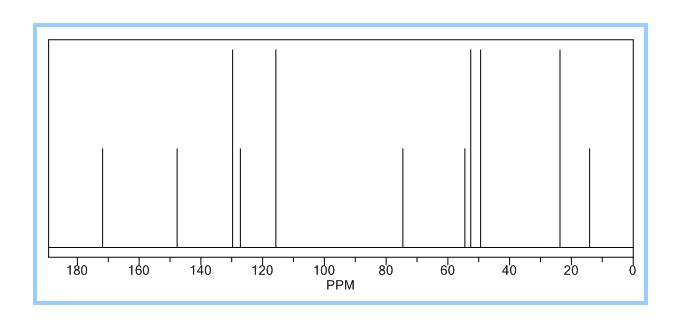
ACTUAL VALUES……..13C NMR (100 MHz, CDCl3): δ ppm 14.3 (CH3), 22.7 ((CH3)2), 46.6 (-CH2-N-CH2-), 49.7 (-CH2-N-CH2-), 60.5 (O-CH2), 62.4 (N-C-), 117.0, 124.3, 128.8, 149.8 (aromatic carbons), 174.3 (C=O).
str3
Paper

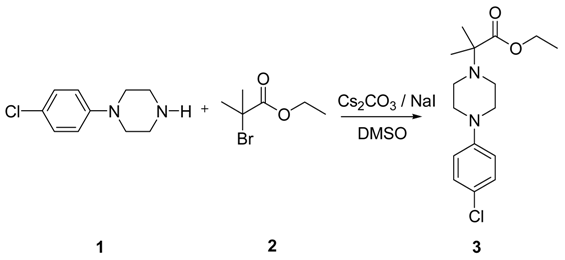
To a solution of 4-(4-chlorophenyl)piperazine dihydrochloride 1 (5.0 g, 0.0185 mol) in DMSO (30 ml), anhydrous cesium carbonate (30.0 g, 0.0925 mol), sodium iodide (1.39 g, 0.0093 mol) and ethyl 2-bromo-2-methylpropanoate 2 (3.97 g, 0.02 mol) were added. The resulting mixture was stirred at 25-30oC for 12 hours. The reaction mass was diluted with water (200 ml) and extracted with ethyl acetate (2 x 200 ml). The ethyl acetate layer was washed with water (2 x 100 ml), dried over anhydrous sodium sulfate (10.0 g) and concentrated under vacuum. The crude product thus obtained was purified by column chromatography (stationary phase silica gel 60-120 mesh; mobile phase 10% ethyl acetate in hexane). The title compound 3 was obtained as a white solid (4.73 g, 82 %).

Molbank 2009 m607 i001
Melting Point: 56oC.
EI-MS m/z (rel. int. %): 311 (100) [M+1]+, 236(40), 197(60), 154(45).
IR ν max (KBr) cm-1: 2839-2996 (C-H aliphatic); 1728 (C=O), 1595, 1505 (C=C aromatic), 1205 (C-O bending), 758 (C-Cl bending).
1H NMR (400 MHz, CDCl3): δ ppm 1.27 (t, 3H, J = 7.2 Hz, -CH2-CH3), 1.35 (s, 6H, 2 x CH3), 2.74-2.76 (m, 4H, J = 4.8 Hz, -CH2-N-CH2-), 3.14-3.17 (m, 4H, J = 4.8 Hz, -CH2-N-CH2-), 4.20 (q, 2H, J = 7.2 Hz, -CH2-CH3), 6.81-6.83 (d, 2H, J = 6.8 Hz, phenyl protons), 7.17-7.20 (d, 2H, J = 6.8 Hz, phenyl protons).
13C NMR (100 MHz, CDCl3): δ ppm 14.3 (CH3), 22.7 ((CH3)2), 46.6 (-CH2-N-CH2-), 49.7 (-CH2-N-CH2-), 60.5 (O-CH2), 62.4 (N-C-), 117.0, 124.3, 128.8, 149.8 (aromatic carbons), 174.3 (C=O).
Elemental analysis: Calculated for C16H23ClN2O2: C, 61.83%, H, 7.46%, N, 9.01%; Found: C, 61.90%, H, 7.44%, N, 8.98%.
Molbank 2009, 2009(3), M607; doi:10.3390/M607

Synthesis of 2-[4-(4-Chlorophenyl)piperazin-1-yl]-2-methylpropanoic Acid Ethyl Ester

1Department of Chemistry, Sambalpur University, JyotiVihar-768019, Orissa, India
2Institute of Chemical Technology (ICT), Matunga, Mumbai-400019, Maharashtra, India
*Author to whom correspondence should be addressed.
Received: 17 May 2009 / Accepted: 30 June 2009 / Published: 27 July 2009
Bijay K Mishra

Professor at Sambalpur University, Chemistry Department

Abstract

The title compound was synthesized by N-alkylation of 4-(4-chlorophenyl)piperazine with ethyl 2-bromo-2-methylpropanoate and its IR, 1H NMR, 13C NMR and Mass spectroscopic data are reported.


/////////

CCOC(=O)C(N1CCN(CC1)c1ccc(cc1)Cl)(C)C

Share

Prof. K.V. Thomas Endowment International Symposium on New Trends in Applied Chemistry (NTAC -2017) 9-11 February, 2017, Department of Chemistry, Sacred Heart College (Autonomous), Thevara, Kochi, India

 CONFERENCE, Uncategorized  Comments Off on Prof. K.V. Thomas Endowment International Symposium on New Trends in Applied Chemistry (NTAC -2017) 9-11 February, 2017, Department of Chemistry, Sacred Heart College (Autonomous), Thevara, Kochi, India
Nov 052016
 

str0


Hearty Welcome to International Symposium, NTAC – 2017

The organizing committee of NTAC – 2017 and The Post Graduate and Research Department of Chemistry, Sacred Heart College (Autonomous),Thevara, Kochi , India are pleased to announce and invite you to attend the Prof. K.V. Thomas Endowment International symposium on New Trends in Applied Chemistry-2017 (NTAC-2017).

Prof. K.V. Thomas Endowment International Symposium on New Trends in Applied Chemistry (NTAC -2017)9-11 February, 2017, Department of Chemistry, Sacred Heart College (Autonomous), Thevara, Kochi, India link ishttp://www.ntac.shcollege.in/ please click


Symposium Dates: 9-11 February, 2017
Last Date for Abstract Submission: 9th December 2016
Last Date for Submission of Full Paper: 9th January 2017
Early Bird Registration: 9th December 2016

SH Symposium

Hearty Welcome to International Symposium, NTAC – 2017

The organizing committee of NTAC – 2017 and The Post Graduate and Research Department of Chemistry, Sacred Heart College (Autonomous),Thevara, Kochi are pleased to announce and invite you to attend the Prof. K.V. Thomas Endowment International symposium on New Trends in Applied Chemistry-2017 (NTAC-2017).
VENUE

Inaugural Session:  Sacred Heart College,Thevara

Technical Sessions:  Crowne Plaza, Kochi

Eminent scholars and young investigators, covering different parts of the globe are expected to participate in the symposium.
The theme of the three day symposium cover the following areas:

  • Medicinal and Pharmaceutical chemistry
  • Flow chemistry
  • Synthesis of natural and unnatural materials
  • Enzymes and biochemistry
  • Organometallic/Catalysis
  • Material science
  • Polymer chemistry
  • Computational chemistry

We cordially invite you to present your most recent research accomplishments, share your knowledge, and actively engage in scientific discourse with other experts in NTAC-2017.

CONTACT
Dr. Grace Thomas
Convener, NTAC – 2017
The Post Graduate and Research Department of Chemistry,
Sacred Heart College (Autonomous), Thevara Kochi-682013 Kerala, India
Ph: +91-9447124334 E-mail: ntac2017@shcollege.ac.in
www.ntac.shcollege.in

http://www.ntac.shcollege.in/

////////

Share

Development and Manufacturing GMP Scale-Up of a Continuous Ir-Catalyzed Homogeneous Reductive Amination Reaction

 PROCESS, SYNTHESIS, Uncategorized  Comments Off on Development and Manufacturing GMP Scale-Up of a Continuous Ir-Catalyzed Homogeneous Reductive Amination Reaction
Oct 202016
 
Evacetrapib.svg

Evacetrapib

Abstract Image

The design, development, and scale up of a continuous iridium-catalyzed homogeneous high pressure reductive amination reaction to produce 6, the penultimate intermediate in Lilly’s CETP inhibitor evacetrapib, is described. The scope of this report involves initial batch chemistry screening at milligram scale through the development process leading to full-scale production in manufacturing under GMP conditions. Key aspects in this process include a description of drivers for developing a continuous process over existing well-defined batch approaches, manufacturing setup, and approaches toward key quality and regulatory questions such as batch definition, the use of process analytics, start up and shutdown waste, “in control” versus “at steady state”, lot genealogy and deviation boundaries, fluctuations, and diverting. The fully developed continuous reaction operated for 24 days during a primary stability campaign and produced over 2 MT of the penultimate intermediate in 95% yield after batch workup, crystallization, and isolation.

Figure

Development and Manufacturing GMP Scale-Up of a Continuous Ir-Catalyzed Homogeneous Reductive Amination Reaction

Lilly Research Laboratories, Eli Lilly and Company, Indianapolis, Indiana 46285, United States
Eli Lilly SA, Dunderrow, Kinsale, Cork, Ireland
D&M Continuous Solutions, LLC, Greenwood, Indiana 46113, United States
Org. Process Res. Dev., Article ASAP
DOI: 10.1021/acs.oprd.6b00148
Publication Date (Web): October 19, 2016
Copyright © 2016 American Chemical Society
*E-mail (Scott A. May): may_scott_a@lilly.com., *E-mail: (Martin D. Johnson): johnson_martin_d@lilly.com., *E-mail: (Declan D. Hurley):hurley_declan_d@lilly.com.

ACS Editors’ Choice – This is an open access article published under an ACS AuthorChoice License, which permits copying and redistribution of the article or any adaptations for non-commercial purposes.


Share

Experimental and Chemoinformatics Study of Tautomerism in a Database of Commercially Available Screening Samples

 Uncategorized  Comments Off on Experimental and Chemoinformatics Study of Tautomerism in a Database of Commercially Available Screening Samples
Oct 182016
 
Abstract Image

We investigated how many cases of the same chemical sold as different products (at possibly different prices) occurred in a prototypical large aggregated database and simultaneously tested the tautomerism definitions in the chemoinformatics toolkit CACTVS. We applied the standard CACTVS tautomeric transforms plus a set of recently developed ring–chain transforms to the Aldrich Market Select (AMS) database of 6 million screening samples and building blocks. In 30 000 cases, two or more AMS products were found to be just different tautomeric forms of the same compound. We purchased and analyzed 166 such tautomer pairs and triplets by 1H and 13C NMR to determine whether the CACTVS transforms accurately predicted what is the same “stuff in the bottle”. Essentially all prototropic transforms with examples in the AMS were confirmed. Some of the ring–chain transforms were found to be too “aggressive”, i.e. to equate structures with one another that were different compounds.

Experimental and Chemoinformatics Study of Tautomerism in a Database of Commercially Available Screening Samples

Chemical Biology Laboratory, Center for Cancer Research, National Cancer Institute, National Institutes of Health, Frederick, Maryland 21702, United States
§ Basic Science Program, Chemical Biology Laboratory, Leidos Biomedical Inc., Frederick National Laboratory for Cancer Research, Frederick, Maryland 21702, United States
J. Chem. Inf. Model., Article ASAP
Publication Date (Web): September 26, 2016
Copyright © 2016 American Chemical Society
Laura Guasch

Laura Guasch

Chemoinformatics Data Scientist

National Institutes of Health
Bethesda, MD, United States

a highly motivated computational chemist and cheminformatician that employ, analyze, and develop computer-based methods to aid in the drug discovery. I enjoy working with experimentalists from the fields of biology, pharmacy, medicine and chemistry on answering relevant questions in drug discovery.

Specialties: CADD; Virtual screening; Pharmacophores; Docking; Homology modeling; Quantum chemistry; SAR/QSAR; ADME/Tox modeling; Drug metabolism; Chemoinformatics; Data mining; Molecular informatics.

Research experience

  • Feb 2012–present PostDoc Position
    National Institutes of Health · National Cancer Institute (NCI): National Institute of Health · Chemical Biology Laboratory
    United States · Frederick
    Development of novel approaches for tautomerism analysis. Structure-based and ligand-based identification and design of anti-cancer and anti-viral agents.
  • Jan 2009–Jun 2009 Research Intern
    University of Innsbruck · Institute of General, Inorganic and Theoretical Chemistry · Theoretical Chemistry
    Austria · Innsbruck
    Discovery of Natural Product PPAR-gamma Partial Agonists by a Pharmacophore-Based Virtual Screening Workflow.
  • Sep 2007–Dec 2011 PhD Student
    Universitat Rovira i Virgili · Department of Biochemistry and Biotechnology · Nutrigenomics Research Group
    Spain · Tarragona
    Identification of natural products as antidiabetic agents using computer-aided drug design methods.
  • Jan 2007–Jun 2007 Research Fellow
    Universitat Rovira i Virgili · Department of Physical and Inorganic Chemistry · Quantum Chemistry Group
    Spain · Tarragona
    Prediction of enantiomeric excesses in asymmetric catalysis using a new QSSR approach based on three-dimensional DFT molecular descriptors
  • Jul 2006–Aug 2006 Summer Intership
    Barcelona Science Park · Quantum Simulation of Biological Processes
    Spain · Barcelona
    Structure and electronic configuration of compound I intermediates Penicillium vitale catalases using techniques of molecular dynamics simulation

Education

  • Sep 2007–Jun 2008 Universitat Rovira i Virgili
    Nutrition and Metabolism · Master of Science
    Spain · Tarragona
  • Sep 2004–Jun 2007 Universitat Rovira i Virgili
    Biochemistry · BSc
    Spain · Tarragona
  • Sep 2002–Jun 2007 Universitat Rovira i Virgili
    Chemistry · Bachelor of Science
    Spain · Tarragona

Awards & achievements

  • Dec 2011 Award: European Doctorate Mention
  • Dec 2011 Award: PhD Extraordinary Award

Marc C. Nicklaus, Ph.D.

Marc C. Nicklaus, Ph.D.
Senior Scientist
Head, Computer-Aided Drug Design (CADD) Group
Dr. Nicklaus received his Ph.D. in applied physics from the Eberhards-Karls-Universitat, Tubingen, Germany, and then served as a postdoctoral fellow in the Molecular Modeling Section of the then called Laboratory of Medicinal Chemistry, NCI. He became a staff fellow in 1998, and a Senior Scientist in 2002. In 2000, he founded, and has been heading since then, the Computer-Aided Drug Design (CADD) Group.

Dr. Nicklaus pioneered work on making large small-molecule databases and related chemoinformatics tools available to the scientific public on the CADD Group’s web server. He also pioneered the analysis of conformational energies of small molecule ligands bound to proteins. As Head of the CADD Group, he oversees the group’s research program in chemoinformatics, fundamentals of protein-ligand interactions, and in silico screening for targets of high interest to NCI. He makes the latter resources available in collaborative projects to improve NCI’s efforts in hit identification and drug design.

Link to additional information about Dr. Nicklaus’ research.

Areas of Expertise

1) chemoinformatics, 2) small-molecule databases, 3) protein-ligand interactions, 4) (quantitative) structure-activity relationships, 5) computer-aided drug design, 6) computational chemistry

CONTACT INFO

Marc C. Nicklaus, Ph.D.
Center for Cancer Research
National Cancer Institute
Building 376, Room 207
Frederick, MD 21702-1201
Ph: 301-846-5903
mn2z@nih.gov(link sends e-mail)

Computer-Aided Drug Design. The Computer-Aided Drug Design (CADD) Group is a research unit within the Chemical Biology Laboratory (CBL) that employs, analyzes, and develops computer-based methods to aid in the drug discovery, design, and development projects of the CBL and other researchers at the NIH. We split our efforts about evenly between support-type projects and research projects initiated and conducted by CADD staff members. We are implementing many projects, and making available resources developed by the CADD Group, in a Web-based manner. This offers three advantages: (1) it frees all users, including the group members themselves, from platform restraints and the concomitant expenses for specific software/hardware, (2) it makes resources and results immediately available for sharing among all collaborators regardless of their location, and (3) helps, without additional effort, further the mission of the NCI as a publicly funded institution by providing data and services directly to the (scientific) public.

Chemical Identifier Resolver (CIR). CIR works as a resolver for many different chemical structure identifiers (e.g. chemical names, InChI, SMILES etc.) and allows one to convert the given structure identifier into a full structure representation or another structure identifier including references to particular databases in which the corresponding structure or structure identifier occurs. CIR offers a simple to use, programmatic application programming interface (API) based on URLs requested by HTTP. This allows easy linking of CIR and its content to other scientific web services and program packages. CIR currently provides access to 120 million structure records.

Enhanced NCI Database Browser. The Enhanced NCI Database Browser can be used to search the 250,000-compound Open NCI Database. This dataset is the publicly available part of the half-million structure collection assembled by the NCI’s Developmental Therapeutics Program during the program’s 50+ years of screening compounds against cancer and, more recently, AIDS. Visit the CADD Group’s home page or the Enhanced NCI Database Browser service for more information.

Fundamentals of Protein-Ligand Interactions. The non-covalent binding of a drug to the binding site of an enzyme (or other biomacromolecule) is the fundamental process of most drug actions. In spite of a vast body of experimental data available on protein-ligand complexes, mostly obtained by X-ray crystallography, there are still open questions of how this binding process occurs at the atomic and quantitative energetic level. One of the issues is the range of conformational energies one can expect to find for the small-molecule ligand bound to proteins, which we found to be higher than generally assumed. This has led us to broader questions regarding x-ray crystallographic methodologies, such as whether quantum-mechanical refinement (or re-refinement) of protein ligand structures may improve structural quality in various ways.

HIV Integrase. A long-standing interest of our group has been HIV integrase (IN) as a drug development target. This enzyme catalyzes the integration of the viral DNA into the human DNA, which is an essential step in the viral replication cycle. Only a handful of approved drugs so far are based on IN inhibition. We have been utilizing all available experimental results, be they structural, mechanistic, or biochemical, to model and better understand inhibition of IN by small molecules. A recent expansion of these efforts is our work aimed at developing HIV microbicides for the prevention of infection with HIV by topical application such as vaginal gels.

Among our main collaborators are Stephen Hughes and Yves Pommier, NCI; Wolf-Dietrich Ihlenfeldt, Xemistry, Germany; Vladimir Poroikov, Russian Academy of Medical Sciences, Moscow; and Raul Cachau, Leidos, FNLCR.

Scientific Focus Areas:

Biomedical Engineering and Biophysics, Chemical Biology, Computational Biology, Structural Biology
/////////////Experimental, Chemoinformatics, Tautomerism,  Database,  Commercially Available,  Screening Samples
Share

Process Validation of Existing Processes and Systems Using Statistically Significant Retrospective Analysis

 Uncategorized  Comments Off on Process Validation of Existing Processes and Systems Using Statistically Significant Retrospective Analysis
Oct 162016
 

Process Validation of Existing Processes and Systems Using Statistically Significant Retrospective Analysis – Part One of Three


The FDA defined Process Validation in 1987 by the following: “Process Validation is establishing documented evidence which provides a high degree of assurance that a specific process will consistently produce a product meeting its predetermined specification and quality attributes.” 1The purpose of this article is to discuss how to validate a process by introducing some basic statistical concepts to use when analyzing historical data from Batch Records and Quality Control Release documents to establish specifications and quality attributes for an existing process. In an ideal world, the qualification of processing equipment, utilities, facilities, and controls would commence at the start up of a new plant or the implementation of a new system. This would be followed by the validation of the process based on developmental data and used to establish the product ranges for in process and final release testing. However, the ideal case may not exist and thus there are incidences where commissioning of facilities or new systems occurs concurrently with the qualification and process validation; or the facility and equipment are “existing” and there is no such documentation. Some facilities, equipment, or processes pre-date the above definition by many years and therefore have never been validated on qualified equipment, utilities, facilities, and controls. Additionally, in some cases, no developmental data exists to establish the product ranges for in process and release testing.

Basics of Process Validation

Before examining the existing processes, it is important to first understand the basic concepts of Process Validation. Figure 1 is a flow chart defining Process Validation from the developmental stage to the plant floor. As a simplistic example, a process begins with the raw materials being released, then the raw materials are mixed, pH is adjusted, purification occurs by gel chromatography, excipients are added for final formulation, and the product is filled and terminally sterilized. Each of these steps has defined functions and therefore would have a designed goal. For example, purification would not begin until the desired pH is reached in the previous step. Therefore, the desired pH is an in process attribute of the pH adjustment stage and the amount of buffer used to adjust the pH is a processing parameter. Each of these steps has attributes that one would want to monitor to determine that the product is being produced acceptably at that step such that the next process step can start. The ranges for these attributes are generally determined by process development data so that if the process attributes are met, then there is a high degree of confidence that the final container is filled with a product of acceptable attributes as determined by the developmental data.

Click on image for larger view

During Process Validation, there needs to be approved Standard Operating Procedures (SOPs) in place that Plant Operators have been trained on. Analytical testing should be performed by SOPs and the Quality Control (QC) analysts should be trained in these SOPs as well. The analytical tests should have been previously validated by normal analytical methods validation and documented as such. Also, the equipment used to prepare product must be documented to be qualified for its installation, operation, and performance, commonly referred to as IQ, OQ, and PQ. There are methods for performing such qualification retrospectively, but for the purpose of this discussion, it is only important to note that the equipment must be qualified.

Relating Process Validation to Existing Processes

Existing processes may lack developmental data for in process ranges and release testing. If a retrospective analysis of existing data is used to establish process ranges, including input, output, and in process testing parameters, then the process can be treated like a new process by following the basics of Prospective Process Validation. The difference between traditional Prospective Process Validation and Prospective Process Validation based on retrospective analysis is that in place of developmental data to establish ranges, the retrospective analysis reviews data from past Batch Production Records, QC test reports, product specs, etc. Thus the items that need to be in place are: approved SOPs, and Batch Records with personnel training, equipment qualification (IQ, OQ, PQ), QC methods validated, approved SOPs and training for QC personnel. With these in place, all that is missing is a Process Validation Protocol with defined ranges. The best sources of this information are approved completed batch records, process deviation reports, QC Release data, and small-scale studies. From these, the following items must be completed:

  • Critical parameters and input and output parameters must be defined.
  • A statistically valid time frame or number of batches must be determined.
  • The data used to establish the parameters must be extracted from controlled documents.
  • The data extracted from the controlled documents will be analyzed to establish ranges.

Each one of these steps will be examined in the following sections to describe them in further detail.

Critical parameters and input and output parameters defined.

In The Guidelines on General Principles of Process Validation, 15 MAY 1987, it states that:

The validity of acceptance specifications should be verified through testing and challenge of the product on a sound scientific basis during the initial development and production phase.1

It is important to determine which parameters in your process are critical to the final product. When determining these parameters and attributes a variety of personnel with different expertise should be utilized. Assembling a team of professionals is a starting point and this committee should be a multi-disciplined team including Quality, Validation, Systems Engineering, Facility Engineering, Pharmaceutical Sciences (or R&D), and Manufacturing. When determining the parameters and attributes which are critical, it is important to consider those which if they were not controlled or achieved, then the result would have an adverse effect on the product. A risk assessment should be performed to analyze what the risk is and what the results are if a specific parameter or attribute is not controlled or achieved (e.g. the resulting product would be flawed). Risk assessment is defined by The Ontario Ministry of Agriculture, Food and Rural Affairs as:

  1. the probability of the negative event occurring because of the identified hazard,
  2. the magnitude of the impact of the negative advent, and
  3. consideration of the uncertainty of the data used to assess the probability and the impact of the components. 2

Click on any image for larger view

Figure 2 is a list of general questions to consider when assessing risk while Figure 3 is an example of Fault Tree Analysis – a formal approach to evaluating risk, where a Top Level Event is observed and through questions and observations the cause of the event can be determined.

National Center for Drugs and Biologics and National Center for Devices and Radiological Health, “Guidelines on General Principles of Process Validation,” Rockville MD. 15 MAY 1987.National Center for Drugs and Biologics and National Center for Devices and Radiological Health, “Guidelines on General Principles of Process Validation,” Rockville MD. 15 MAY 1987.Ontario Ministry of Agriculture, Food and Rural Affairs (2000), Queen’s Printer for Ontario, Last Updated March 22, 2000; WEB:http://www.gov.on.ca/omafra/english/research/risk/assum1b.html.

Process Validation of Existing Processes and Systems Using Statistically Significant Retrospective Analysis – Part Two of Three


A Statistically Valid Time Frame or Number of Batches

How large of a sample set is needed of previously recorded data to determine ranges that are truly representative of the process, and will the ranges be useful in the Validation effort and not set one up for failure? This is a difficult question to answer, and it is important to note that the batches selected should have no changes between them, thus be produced with the same processing conditions. The draft FDA Guidance for Industry, Manufacturing, Processing, or Holding Active Pharmaceutical Ingredients from March of 1998 suggests that 10-30 consecutive batches be examined to assess process consistency. 1

This is a good target statistically because when selecting a sample size or population, the concept of Normality or Degree of Normality becomes important. As a general rule of thumb, the population should be large enough that the distribution of the samples within the population approaches a Normal or Gaussian distribution (one defined by a bell-shaped curve). Thus in theory if the samples are normally distributed then 99% of the samples will fall within the +/- 3 Standard Deviation (S.D.) range. 2 When considering this, one should think in the sense of Statistical Significance (the P-Value). The P-Value is the significance that a given sample will be indicative of the whole population. Thus at 99% (a P-Value of 0.01) then a given sample has 1% chance of falling outside the +/- 3 S.D. range or (assuming no relationship with other variables) the sample has a 99% statistical significance as representative of the population. Finally, when considering the central limit theorem, which has the underlying concept that as the sample size gets larger, the distribution of the population becomes more normal, then in general a sample size of 10 – 30 as the FDA suggests would have a high chance of being distributed normally.

The data used to establish the parameters must be extracted from controlled documents.
When the number of batches to review is selected, the next step is to determine from what documents the processing data will be extracted. Typically the range establishing data must be taken from approved and controlled documents (see the examples below).

Examples of Controlled Documents:

  • Batch Production Records (BPRs)
  • Quality Control (QC) Lab Reports
  • Limits establish by Licensure
  • Product License Agreement (PLA)
    – Biologic License Agreement (BLA)
    – New Drug Application (NDA) or Abbreviated (ANDA)
  • Product Release Specifications
  • Small scale bench studies simulating plant environment.

The data extracted from the controlled documents will be analyzed to establish ranges.
Having established where the data will be selected from, the data must then be analyzed for specific trends such to define ranges for the Process Validation Protocol’s acceptance criteria. This acceptance criteria will be what the “Actual” process data collected during the execution of the Protocol will be compared to, in order to verify its acceptance. This part is where much thought needs to be applied so that the acceptance criteria are not so tight that failure is eminent or so broad that the achievement of the criteria proves nothing. Listed below are general steps that can be incorporated to determine the analysis.

  1. Draw “X Charts” and analyze for outliersApply a model to determine Normality
  2. Determine the +/- 3 S.D. range and plot on Trend Chart
  3. Determine the Confidence Interval as compared to +/- 3 S.D.
  4. Process Capability Indices
  5. Recording the Maximum and Minimum
  6. Assign Acceptance Criteria Range and justify

Drawing Trend Charts

Trend Charts, also referred to as X-Charts, are a good way of plotting data points from a set of data where the target is the same metric (for example pH as measured at a specific point in the process). It is a matter of defining the X-axis by the number of samples and the Y-axis by the metric that is being used. As an example, the X-axis could be a list of the batches by batch number and the Y axis could be pH. Figure 4 is an example of a type of trend chart. This way the data is presented graphically and can be appreciated with respect to setting a range.

With the data plotted, one can quickly assess any visible trends in the data. Additionally one can no begin the task of applying statistics to the data. It is important to determine if there are outliers in the data. Outliers may exist and can usually be rationalized by adverse events in processing as long as they are reported appropriately. Outliers can also exist as samples that are “statistically insignificant.” As mentioned before, the P-Value is the significance that a given sample will be indicative of the whole population so that outliers would have a very low P-Value. One method for determining outliers is to use a box-plot where a box is drawn from a lower point (defined typically by the 25th percentile) to an upper point (typically the 75th percentile). The “H-spread” is defined as the distance between the upper and lower points. 3 Outliers are then determined to be any data that falls outside a predetermined multiplier of the H-spread. For example the lower outlier limit and upper outlier limit are defined as 4 times the H-Spread, anything above or below these limits is statistically insignificant and are outliers.

Apply a model to determine Normality

With the accumulated data plotted, the Degree of Normality should be investigated so that the data can be analyzed by the appropriate method. There are several models for determining the Degree of Normality; some common ones are the Kolmogorov-Smirnov test, Chi-Square goodness-of-fit test, and Shapiro-Wilks’ W test. 4 Once the Degree of Normality is determined a more appropriate statistical method can be applied for setting ranges. If the data is determined to be non-Normal than there are two approaches to evaluating the data. The first way is to apply a Nonparametric Statistical model (e.g. the Box-Cox Transformation 5 ), however, these tests are considered to be less powerful and less flexible in terms of the conclusions that they provide, so it is preferred to increase the sample size such that a normal distribution is approached. 5 If the data is determined to be Normal or the sample size is increased such that the data is distributed more normally, then the data can be better analyzed for it’s range characteristics.

Click on any image for larger view

Determine the +/– 3 SD range and plot on Trend Chart

The data having now been displayed graphically should be analyzed mathematically. This can be done by using simple statistics where the mean is determined as well as the standard deviation. The mean refers to the average of the samples in the population. The standard deviation is the measure of the variation in the population from the mean. If the distribution proves to be normal, as from our normality tests above or by selecting a large enough population such that the central limit theorem predicts the distribution to be normal, then it stands that 99% of the data will fall within the +/–3 SD range. Using our example from Figure 4, the data is analyzed for its mean and standard deviation using the displayed formulas in Figure 5. Once this is determined, the +/– 3 SD can be applied to the trend charts by drawing them as limits at their values. This graphically displays the data as it is applied per batch and how it fits within the statistical limit of +/– 3 SD (see Figure 6.)

  1. U.S. Department of Health and Human Services, Food and Drug Administration, Center for Drug Evaluation and Research, Guidance for Industry, Manufacturing, Processing, or Holding Active Pharmaceutical Ingredients, March 1998, 36
  2. StatSoft, Inc. (1999). Electronic Statistics Textbook. Tulsa, OK: StatSoft. WEB: http://www.statsoft.com/textbook/stathome.html
  3. Rice Virtual Lab in Statistics (1993-2000), David M. Lane, HyperStat Online, Houston TX, WEB:http://www.ruf.rice.edu/~lane/rvls.html
  4. StatSoft, Inc. (1999). Electronic Statistics Textbook. Tulsa, OK: StatSoft. WEB: http://www.statsoft.com/textbook/stathome.htm
  5. Box, G.E.P., and Cox, D.R. (1964), “An Analysis of Transformations,” J. Roy. Stat. Soc., Ser. B.


Process Validation of Existing Processes and Systems Using Statistically Significant Retrospective Analysis – Parts Three of Three


Determine the Confidence Interval as compared to +/- 3S.D. With the +/- 3 S.D. ranges determined, it can be considered important to evaluate what confidence there is that the next data point will fall within this range. The rationale for determining this level is to justify that the +/- 3 S.D. range provides a confidence that 99% of the data is within that range. Similar to the +/- 3 S.D. range, the confidence interval is a range between which the next measurement would fall. This level is typically 99% or greater. Thus a 99% confidence interval means, “there is 99% insurance that the next value would be in the range.” To calculate a 99% Confidence Interval, one needs to consider the area under the standard normal curve, the mean, the standard deviation, and the population size. Determining this level can be done using the formula in Figure 7. The confidence interval can be added to our previous example and is displayed in Figure 8.

Figure 8: Trend Chart with +/- 3 S.D. and Confidence Interval.

Figure 7: Definition of Confidence Interval Formulas.

Following our example:

Confidence Interval (99.9%) = 6.23 ± snc ( 0.151202/(30) 1/2)

Confidence Interval (99.9%) = 6.95 to 6.02

The confidence interval at 99.9% is slightly more narrow than the +/- 3 S.D. range which follows the trend if the +/- 3 S.D. range provides that 99% of the data will be within the range if the data is normally distributed.

As can be seen in the trend charts, the data fits well within the +/- 3 S.D. range, and therefore the confidence level is very high that the next data point that is collected will be within this range. Therefore this range may be appropriate to use as acceptance criteria based on the statistics. If the confidence level was wider than the +/- 3 S.D., then the data would have to be analyzed such to investigate if there were errors in calculating the degree of normality, the +/- 3 S.D., the confidence level, the outliers, or errors in the sampling technique to show that it was not computational error.

Process Capability Factors

Another method to setting ranges to be used as acceptance criteria are the Process Capability Indices defined by:

CPu = (USL – µ) / s (or in our example 3 S.D.)

CPl = (µ – LSL) / s (or in our example 3 S.D.)

Where:

USL = Upper Specification Limit

LSL = Lower Specification Limit

An industry accepted standard CP would be 1.33.1 This would mean that only 0.003% of the testing results would be out of the specification or 99.997% would be within the specification. This is a similar concept to confidence level.

Recording the Maximum and Minimum

Recording the maximum and minimum values in the data is important because it is a quick way to see if the data is all within the +/- 3 S.D. range. Additionally, if the maximum and minimum are within the +/- 3 S.D. range, than there is an additional level of confidence since all of the data would be within the range. Lastly, the data may be determined to be non-normally distributed and in such case, confidence may predict to high a possibility for failure at the +/- 3 S.D. range so in the interim, the maximum, and minimum values can be selected to be the range until further data can be collected to define the range (this refers back to increasing the sample size in order to approach a more normal distribution).

Assign Acceptance Criteria Range and Justify

Using all of the above analysis techniques, knowledge of the process and agreement on by a cross-discipline committee, acceptance criteria ranges can be assigned for the critical parameters and attributes. A general course of action would be to start by recording all the data at a given point in a spreadsheet, calculating the mean, S.D., population size, +/- 3 S.D., 95% and 99% confidence intervals, plotting the trend charts with appropriate ranges, and then deciding on which range makes the best sense. When selecting the acceptance criteria, a cross-functional committee should be utilized with backgrounds of QA, Manufacturing, Validation, R&D, and Engineering present. The

ranges should be selected and justified by scientifically sound data and conclusions. The ranges should be within the PAR for the product, which means that if +/- 3 S.D. is selected, the range should be checked at the upper and lower limits to verify that acceptable product is prepared. This should be done prior to a final agreement on the range and incorporation into the validation protocol. A report should be written to document the ranges with the rationale for selecting them and the justification for determining the limits as well as any determination that the ranges are within the PAR. Additionally, those ranges which are not to be included should be discussed within the report to justify why they are not to be recorded. A process validation protocol should be prepared with theses ranges for acceptance criteria and the process should be run at a target within the acceptance criteria ranges at least three consecutive times using identical procedures to verify that the process is valid.

Summary

Since the ideal case of validating a process during its implementation does not always exist in the pharmaceutical, biopharmaceutical, biotechnology or medical device industries, it may be important to determine a way to validate these processes using historical data. The historical data can be found in a variety of places as long as it is approved (e.g. approved and completed BPRs or quality control release documents, etc). A cross-functional team should perform a risk assessment on the parameters and attributes to determine which ones would be included in the process validation. A range establishing study for the attributes and parameters should be performed to evaluate historical data and analyze the data set for the concepts of normality, variation (standard deviation), and confidence. With a high degree of confidence, acceptance criteria ranges should be set for each parameter and attribute and a process validation protocol should be written with the appropriate ranges. This protocol should be approved and executed at target settings within the acceptance criteria ranges, from the start of the manufacturing process to the finish using qualified equipment, approved SOPs, and trained operators. In a final report for the process validation, the degree to which the process is valid would be determined by the satisfaction of the approved acceptance criteria.

References

1. Box, G.E.P., and Cox, D.R. (1964), “An Analysis of Transformations,” J. Roy. Stat. Soc., Ser. B., 26, 211.

2. Kieffer, Robert and Torbeck, Lynn, (1998), Pharmaceutical Technology, (June), 66.

3. Lane, David M., Rice Virtual Lab in Statistics (1993-2000), HyperStat Online, Houston TX, WEB: http://www.ruf.rice.edu/~lane/rvls.html.

4. National Center for Drugs and Biologics and National Center for Devices and Radiological Health,(1987) “Guidelines on General Principles of Process Validation,” Rockville MD. 15 MAY.

5. Ontario Ministry of Agriculture, Food and Rural Affairs (2000), Queen’s Printer for Ontario, Last Updated March 22, 2000; Web: http://www.gov.on.ca/omafra/english/research/risk/assum1b.html.

6. StatSoft, Inc. (1999). Electronic Statistics Textbook. Tulsa, OK: StatSoft. WEB: http://www.statsoft.com/textbook/stathome.html.

7. U.S. Department of Helath and Human Service, Food and Drug Administration, Center for Drug Evaluation and Research, Center for Biologics Evaluation and Research, Center for Veterinary Medicine, “Guidance for Industry: Manufacturing, Processing, or Holding Active Pharmaceutical Ingredients,” Rickville MD. March 1998, 36.


//////////Process Validation,  Existing Processes and Systems, Retrospective Analysis

Share

Dextropropoxyphene hydrochloride

 Uncategorized  Comments Off on Dextropropoxyphene hydrochloride
Oct 082016
 

Dextropropoxyphene3DanJ.gif

Image result for dextropropoxyphene hydrochloride

Dextropropoxyphene hydrochloride

  • Molecular FormulaC22H30ClNO2
  • Average mass375.932
dextropropoxyphene hydrochloride
(+)-Propoxyphene hydrochloride
(1S,2R)-1-Benzyl-3-(dimethylamino)-2-methyl-1-phenylpropylpropanoathydrochlorid [German]
(2S,3R)-4-(Dimethylamino)-3-methyl-1,2-diphenyl-2-butanyl propanoate hydrochloride (1:1) [ACD/IUPAC Name]
(2S,3R)-4-(Dimethylamino)-3-methyl-1,2-diphenyl-2-butanyl-propanoathydrochlorid (1:1) [German][ACD/IUPAC Name]
(2S,3R)-4-(Dimethylamino)-3-methyl-1,2-diphenylbutan-2-yl propanoate hydrochloride (1:1)
(aS)-a-((1R)-2-(Dimethylamino)-1-methylethyl)-a-phenylbenzeneethanol Propanoate (Ester) Hydrochloride
1639-60-7  CAS
Algafan [Trade name]
Antalvic [Trade name]
benzeneethanol, α-[(1R)-2-(dimethylamino)-1-methylethyl]-α-phenyl-, propanoate (ester), (αS)-, hydrochloride

Dextropropoxyphene[3] is an analgesic in the opioid category, patented in 1955[4] and manufactured by Eli Lilly and Company. It is an optical isomer of levopropoxyphene. It is intended to treat mild pain and also has antitussive (cough suppressant) and local anaesthetic effects. The drug has been taken off the market in Europe and the US due to concerns of fatal overdoses and heart arrhythmias.[5] Its onset of analgesia (pain relief) is said to be 20–30 minutes and peak effects are seen about 1.5–2 hours after oral administration.[1]

Dextropropoxyphene is sometimes combined with acetaminophen. Trade names include Darvocet-N and Di-Gesic,[6] Darvon with APAP (for dextropropoxyphene and paracetamol).[7] The British approved name (i.e. the generic name of the active ingredient) of the paracetamol/dextropropoxyphene preparation is “co-proxamol” (sold under a variety of brand names); however, it has been withdrawn since 2007, and is no longer available to new patients, with exceptions.[8] The paracetamol combination(s) are known as Capadex or Di-Gesic in Australia, Lentogesic in South Africa, and Di-Antalvic in France (unlike co-proxamol, which is an approved name, these are all brand names).

Dextropropoxyphene is known under several synonyms, including:

  • Alpha-d-4-dimethylamino-3-methyl-1,2-diphenyl-2-butanol propionate
  • [(2S,3S)-4-(Dimethylamino)-3- methyl-1,2-diphenylbutan-2-yl] propanoate
  • (+)-1,2-Diphenyl-2-propionoxy- 3-methyl-4-di-methylaminobutane

READ

PDF]Dextropropoxyphene(BAN, pINN)

www.drugfuture.com/mt/dextropropoxyphene.pdf

40 Analgesics Anti-inflammatory Drugs and Antipyretics … NOTE. Compounded preparations ofdextropropoxyphene hydro- chloride may be represented by the …

Image result for dextropropoxyphene SYNTHESIS
Title: Propoxyphene
CAS Registry Number: 469-62-5
CAS Name: (aS)-a-[(1R)-2-(Dimethylamino)-1-methylethyl]-a-phenylbenzeneethanol propanoate (ester)
Additional Names: a-d-4-dimethylamino-3-methyl-1,2-diphenyl-2-butanol propionate; (+)-1,2-diphenyl-2-propionoxy-3-methyl-4-dimethylaminobutane; (+)-4-dimethylamino-1,2-diphenyl-3-methyl-2-propionyloxybutane; a-d-propoxyphene; dextropropoxyphene
Molecular Formula: C22H29NO2
Molecular Weight: 339.47
Percent Composition: C 77.84%, H 8.61%, N 4.13%, O 9.43%
Literature References: Prepn of racemate: Pohland, Sullivan, J. Am. Chem. Soc. 75, 4458 (1953); Pohland, US 2728779 (1955 to Lilly). Prepn of (+)-form: Pohland, Sullivan, J. Am. Chem. Soc. 77, 3400 (1955). Stereochemistry: Sullivan et al., J. Org. Chem.28, 2381 (1963); Casy, Myers, J. Pharm. Pharmacol. 16, 455 (1964). Stereospecific synthesis: Pohland et al., J. Org. Chem. 28,2483 (1963). Metabolism: S. L. Due et al., Biomed. Mass Spectrom. 3, 217 (1976). The a-dl- and d-diastereoisomers possess marked analgesic activity in contrast to the b-diastereoisomers which are substantially inactive. Toxicity: E. I. Goldenthal, Toxicol. Appl. Pharmacol. 18, 185 (1971); J. L. Emerson et al., ibid. 19, 445 (1971). Comprehensive description: B. McEwan, Anal. Profiles Drug Subs. 1, 301-318 (1972). Symposium on pharmacology, toxicology, and clinical efficacy of propoxyphene alone and in combination with acetaminophen: Hum. Toxicol. 3, Suppl., 1S-238S (1984).
Properties: Crystals from petr ether, mp 75-76°. [a]D25 +67.3° (c = 0.6 in chloroform).
Melting point: mp 75-76°
Optical Rotation: [a]D25 +67.3° (c = 0.6 in chloroform)

Derivative Type: Hydrochloride

CAS Registry Number: 1639-60-7
Trademarks: Darvon (AAI Pharma); Deprancol (Parke-Davis); Develin (Gecke)
Molecular Formula: C22H29NO2.HCl
Molecular Weight: 375.93
Percent Composition: C 70.29%, H 8.04%, N 3.73%, O 8.51%, Cl 9.43%
Properties: Bitter crystals from methanol + ethyl acetate, mp 163-168.5°. [a]D25 +59.8° (c = 0.6 in water). Sol in water, alc, chloroform, acetone. Practically insol in benzene, ether. LD50 in mice, rats (mg/kg): 28, 15 i.v.; 111, 58 i.p.; 211, 134 s.c.; 282, 230 orally (Emerson).
Melting point: mp 163-168.5°
Optical Rotation: [a]D25 +59.8° (c = 0.6 in water)
Toxicity data: LD50 in mice, rats (mg/kg): 28, 15 i.v.; 111, 58 i.p.; 211, 134 s.c.; 282, 230 orally (Emerson)
Derivative Type: Napsylate monohydrate
CAS Registry Number: 26570-10-5
Trademarks: Darvon-N (AAI Pharma)
Molecular Formula: C22H29NO2.C10H8O3S.H2O
Molecular Weight: 565.72
Percent Composition: C 67.94%, H 6.95%, N 2.48%, O 16.97%, S 5.67%
Properties: Odorless, white crystalline powder; bitter taste. Sol in methanol, ethanol, chloroform, acetone; very slightly sol in water. LD50 orally in female rats: 990 mg/kg (Goldenthal).
Toxicity data: Odorless, white crystalline powder; bitter taste. Sol in methanol, ethanol, chloroform, acetone; very slightly sol in water. LD50 orally in female rats: 990 mg/kg (Goldenthal)
Derivative Type: a-l-Form see Levopropoxyphene
Derivative Type: a-dl-Form
Additional Names: Racemic propoxyphene; diméprotane
Derivative Type: a-dl-Form hydrochloride
Properties: Crystals from methanol + ethyl acetate, mp 170-171°. Soluble in water, alcohol, chloroform. Practically insol in benzene, ether.
Melting point: mp 170-171°
Derivative Type: b-dl-Form
Properties: Crystals from acetone + ether. mp 187-188°. More soluble than the a-form.
Melting point: mp 187-188°
 
NOTE: Bulk dextropropoxyphene (non-dosage forms) is a controlled substance (opiate): 21 CFR, 1308.12; dextropropoxyphene is a controlled substance (narcotic): 21 CFR, 1308.14.
Therap-Cat: Analgesic (narcotic).
Keywords: Analgesic (Narcotic).

Of the many phenylpropylamines which show analgesic activity, the two most important are methadone and propoxyphene. The optically active alpha-dextro 0 stereoisomer of propoxyphene is the only stereoisomer of propoxyphene which possesses analgesic properties. It is commonly used in its hydrochloride salt form which is a bitter, white crystalline powder freely soluble in water and soluble in alcohol. Its chemical name is $ eC-d-1 ,2-diphenyl-2-propionoxy-3-methyl-4-dimethyl- aminobutane hydrochloride and is sold under several different trademarks including, for example, DARVON, DOLENE, and SK-65. The napsylate salt, i.e. , the naphthalene sulfonate, is also used in many drug forms. 0 It has previously been made from the hydrochloride salt.

Preparation of d-propoxyphene hydrochloride was first described by A. Pohland and H.R. Sullivan at J. Am. Chem. Soc. , Volume 75, pp. 4458(1953). Therein, the authors disclosed a synthesis involving several stages, (1) preparation of an aminoketone called

,-dimethylaminobutrophenone by addition of the secondary amine to phenylpropenyl ketone; (2) a Grignard reaction of the amino ketone with benzylmagnesium chloride to yield the amino, hydrochloride-carbinols described as Λr(75%) and ^-(15%) 4-dimethylamino-l ,2-diphenyl-3-methyl-2-butanol hydrochloride (sometimes hereinafter referred to as d-oxyphene hydrochloride); and (3) acylation of the flCramino carbinol hydrochloride by addition of an equal weight of propionic anhydride and five times that weight of pyridine and heating- to reflux for several hours. Note the following reaction formula:


Image result for dextropropoxyphene hydrochloride


After cooling to recover the crude product, it was purified by two recrystallizations from methanol-ethyl acetate solution resulting in a yield of 70%.

Although this work confirmed that the oc and not the -diastereoisomers of propoxyphene gave rise to analgesic activity, it was still necessary to determine which of the optical forms of the ■aC-diastereoisomer, i.e. βC-d(+) or ύL-l(-), was responsible for the analgesic activity. Accordingly, Pohland and Sullivan reported in the J. Am. Chem. Soc. , Volume 77, pp. 3400 (1955) their work on resolution of α.-dl-4-dimethylamino-l , 2-diphenyl-3-methyl-2-butanol by fractional crystallization of its d-camphorsulfonic acid salt. From the respective d-d and α-1 carbinol d-camphor- sulfonic salts the optically active hydrochloride salts were prepared. The ofc-d-hydrochloride was acylated using propionic anhydride and triethylamine, while the ot-1 hydrochloride was acylated using propionic anhydride and pyridine. It was therein found that only the C-d stereoisomer gave the analgesic response. However, final purification of the hydrochloride salt required additional HC1 and three recrystallizations and with yields of less than about 70%.

In 1963, Pohland, Peters and Sullivan reported in the J. Org. Chem. , Vol. 28, pp. 2483, an alternative synthetic route for Λ-d-propoxyphene hydrochloride. Working backwards from the desired optically active isomer of propoxyphene by its hydrolysis and dehydration to stilbene, followed by ozonization of the stilbene, the authors discovered good yield of (-)-^-dimethyl- amino-^rmethylpropiophenone. This optically active amino ketone was found to be surprisingly stable in salt form thus permitting its use as a starting material for a stereo selective synthesis of ύC-d-propoxyphene. Racemic ^-dimethylamino-tf-methylpropiophenone was resolved by crystallization of the dibenzoyl tartrate salts from acetone solution. The use of dibenzoyl-(-) -tartaric acid yielded the insoluble salt having (-)-^-dimethylamino-<-methylpropiophenone, while the use of the (+) tartaric acid yielded the salt having the (+) amino ketone isomer.

It is of interest that according to this reported synthesis, it was the (-) isomer of/6-dimethylamino— efc-methylpropiophenone, which when liberated from its (-) tartrate salt by Grignard reaction with benzylmagnesium chloride provided good yields of the (+) or (d) isomer ύfc-1,2-diphenyl-3-methylτ4-dimethylamino-2-butanol which of course is the carbinol precursor for oC-d-propoxyphene. The reported yields were 69%. The acylation was accomplished as had been previously reported, i.e., by means of propionic anhydride in either triethylamine or pyridine.

In 1978, Hungarian Pat. No. 14,441 disclosed a synthesis of cfc-d-propoxyphene employing the above-described method except that (1) the (+) tartaric acid was employed in the resolution of the racemic ^-dimethylamino-ot-methylpropiophenone and (2) the acylation was accomplished by reacting triethylamine in chloroform, propionyl chloride and the carbinol rather than propionyl anhydride and the carbinol hydrochloride. Still the product was precipitated in ether and required an amine catalyst.

Most recently, U.S. Patent Number 4,661,625 disclosed a synthetic method involving acylation of the carbinol (d-oxyphene) with propionyl chloride and thionyl chloride in dichloromethane. The yield of d-propoxyphene hydrochloride was improved to at least 76%, but use of the toxic additive thionyl chloride was required to get to that level. In addition, methylene chloride or another chlorinated solvent was required. Chlorinated impurities resulted and caused difficulties in purification.

However, a method that provides even higher yields of d-propoxyphene and its salts and doesn’t require toxic and/or hazardous additives and solvents has long been highly desired. It is an object of the present invention to provide a means of producing d-propoxyphene in high yields without the need for amines or chlorinated solvents. It is a further object to provide methods of producing the hydrochloride and napsylate salts of d-propoxyphene in higher yields than previously obtainable.

Patent

https://www.google.com/patents/WO1990014331A1?cl=en

Example 1

To a 5-litre flask equipped with an overhead stirrer, a nitrogen feed, thermometer, and heating mantle was added 2.0 kg (7.06 moles) d-oxyphene purchased from Merrell-Dow. To this was added 2.0 L (15.6 moles) propionic anhydride (Aldrich) with stirring and heating. The temperature was raised to 75-80 °C over 35 minutes and maintained at no more than 81 °C for four hours. The mixture was cooled to room temperature and then added dropwise to 10.0 L deionized water over 30 minutes. A clear yellow solution resulted. 1.85 L ammonium hydroxide was added to raise the pH to 8.8. Seed crystals of d-propoxyphene were added and white solids precipitated. The solution and precipitate were chilled by immersion in ice bath and filtered. The solid was dried by vacuum and then placed in a 60 βC oven for 2 days. The yield was 2390 g of white crystals, 99.7% of theory.

Example 2

To a 22-litre vessel equipped with a stirrer. heating mantle, thermometer and a nitrogen feed was added 5.0 kg (17.6) moles d-oxyphene (Merrell-Dow). To it was added 5.0 L (39.0 moles) propionic anhydride (Eastman-Kodak). The temperature was raised and varied from 73-88 βC over 4 1/4 hours. The reaction mixture was split into two parts, each about 5L, and each was treated as follows: The mixture was slowly added to a mixture of 3.125 L absolute ethanol and 9.37 L deionized water. A mild odor of ethyl propionate was noted, but no phase separation was seen. The pH was adjusted to 8.8 with ammonium hydroxide, and white solids slowly precipitated. The mixture was chilled to approximately 9 °C and filtered with vacuum. The solids were washed twice on the filter with 2 L deionized water and reslurried in 10 L at room temperature. They were refiltered and again washed twice with 2 L deionized water. The solids were air-dried and analyzed by NMR, which showed no ethanol remaining. The combined yield was 6.12 kg, 102% of theory, m.p. 73.8 – 75.1 βC.

Example 3

A 100-g sample of d-propoxyphene prepared as in Example 1 was dissolved in 481 mL ethyl acetate. 26.0 mL methanolic HC1 (11.7 M) was added. The mixture was warmed to between 30 and 40 °C. The mixture then slowly crystallized. It was cooled to below 5 °C and filtered. The crystals were washed with 50 mL cold ethyl acetate. The yield was 79.3 g (72%).

Unconverted free base was recovered from the ethyl acetate filtrate by twice extracting with 100 mL of water acidified with 5 drops cone. HCl. The aqueous extracts were combined, and the remaining ethyl acetate was removed by blowing air over the solution. When the ethyl acetate was completely removed, the pH was raised to 9.0 by adding ammonium hydroxide; solids formed that were filtered, washed and dried. 25.3 g d-propoxyphene were recovered. The total yield of salt and recovered free base was 94.5%.

Example 4

A 40-g sample of d-propoxyphene prepared as in Example 2 was slurried in 169 mL deionized water with stirring and 10.9 mL cone. HC1 were added.

Seventy mL ethanol were added; then 30.15 g sodium napsylate were added with stirring. The resulting slurry was heated to between 50 and 60 °C until a solution was obtained. The solution was filtered while hot and then allowed to cool, with stirring. Crystallization started on cooling. The solution was then chilled to less than 5 °C and filtered. The solids were washed with 210 mL deionized water and then reslurried in 195 mL deionized water. The slurry was stirred for 15 minutes, then filtered. The solids were again washed with 210 mL deionized water, collected, and dried overnight at 50-60 °C. The yield was 63.6 g (95.4 percent of theory).


PATENT

Image result for dextropropoxyphene SYNTHESIS

Patent EP0225778B1 – Improved synthesis and purification of alpha …

www.google.com

Figure imgb0001


References

  1. ^ Jump up to:a b c d e Davis, MP; Glare, PA; Hardy, J (2009) [2005]. Opioids in Cancer Pain (2nd ed.). Oxford, UK: Oxford University Press. ISBN 978-0-19-157532-7.
  2. Jump up^ “PRODUCT INFORMATION PARADEX” (PDF). TGA eBusiness Services. Aspen Pharmacare Australia Pty Ltd. 2 March 2010. Retrieved 9 April 2014.
  3. Jump up^ US Patent 2728779 – Esters of Substituted Aminobutanes
  4. Jump up^ Thieme Chemistry (Hrsg.): RÖMPP Online – Version 3.32. Georg Thieme Verlag KG, Stuttgart, 30. April 2013.
  5. Jump up^ Physicians Say Good Riddance to ‘Worst Drug in History’ By Allison Gandey. February 2, 2011
  6. Jump up^ “Consumer Medicine Information: Digesic” (PDF). Aspen Pharmacare Australia Pty Ltd.
  7. Jump up^ Nursing Drug Handbook, Springhouse, page 306
  8. Jump up^ BNF Edition 57, BNF.org
  9. Jump up^ “Restless legs syndrome: Definition from”. Answers.com. Retrieved 2009-08-19.
  10. Jump up^ “Restless Leg Syndrome – Sleep Medicine Centers of WNY”. Sleepmedicinecenters.com. Retrieved 2009-08-19.
  11. Jump up^ “Causes, diagnosis and treatment for the patient living with Restless Legs Syndrome (RLS)”. Restless Leg Syndrome Foundation. 1 April 2006. Retrieved 2009-08-19.
  12. Jump up^ http://www.aspenpharma.com.au/product_info/pi/PI_Sigma-Dexamphetamine.pdf
  13. Jump up^ “Blockade of Rat α3β4 Nicotinic Receptor Function by Methadone, Its Metabolites, and Structural Analogs — JPET”.
  14. ^ Jump up to:a b c Nickander et al., 1984
  15. ^ Jump up to:a b c Strom et al., 1985b
  16. Jump up^ Holland & Steinberg, 1979
  17. Jump up^ Bredgaard, Sorensen et al., 1984
  18. Jump up^ Stork et al., 1995
  19. Jump up^ Wilson, Charles Owens; Gisvold, John H. Wilson and Gisvold’s textbook of organic medicinal and pharmaceutical chemistry. Lippincott Williams & Wilkins. ISBN 0-7817-3481-9.
  20. Jump up^ “FDA pulls common pain med off the market”. November 19, 2010. CNN.
  21. Jump up^ http://www.tga.gov.au/newsroom/media-2011-dextropropoxyphene-111122.htm
  22. Jump up^ “Legal win keeps banned painkiller on the shelves”. The Sydney Morning Herald. 22 February 2012.
  23. Jump up^ “Questions and answers on the withdrawal of the marketing authorisations for medicines containing dextropropoxyphene” (PDF). European Medicines Agency. 25 June 2009. Retrieved 2009-09-08.
  24. Jump up^ “Paradex And Capadex To Be Withdrawn From NZ”. Retrieved 2010-02-21.
  25. Jump up^ “Fasta kombinationer av smärtstillande läkemedel innehållande dextropropoxifen försvinner från marknaden under hösten 2005” [Fixed combinations of analgesic drugs containing dextropropoxyphene disappear from the market in the autumn of 2005] (in Swedish). Läkemedelsverket. 5 May 2005.
  26. Jump up^ EU-decision http://www.medicinesauthority.gov.mt/pub/Dextropoxyphene.pdf
  27. Jump up^ “Dextropropoxyphene is removed from the market” (in Swedish). 5 May 2005.
  28. Jump up^ Painkiller Scrapped Over Suicides
  29. Jump up^ “Distalgesic (discontinued in the UK – December 2007)”. netdoctor. 9 January 2008. Retrieved 8 September 2013.
  30. Jump up^ BNF.org, BNF edition 57, Retrieved 28 August 2009
  31. ^ Jump up to:a b “Withdrawal of co-proxamol products and interim updated prescribing information”.Medicines and Healthcare products Regulatory Agency (MHRA). 31 January 2005. Retrieved August 28, 2009.
  32. Jump up^ “Outcome of the public request for information on the risks and benefits of the pain killer co-proxamol”. Medicines and Healthcare products Regulatory Agency (MHRA).
  33. Jump up^ “Co-proxamol: outcome of the review of risks and benefits”. Questions and Answers leaflet, Retrieved August 28, 2009
  34. Jump up^ Hawton K, Bergen H, Simkin S, Brock A, Griffiths C, Romeri E, Smith KL, Kapur N, Gunnell D (June 2009). “Effect of withdrawal of co-proxamol on prescribing and deaths from drug poisoning in England and Wales: time series analysis” (PDF). BMJ. 338: b2270. doi:10.1136/bmj.b2270. PMC 3269903free to read. PMID 19541707.
  35. Jump up^ Co-Proxamol: 13 Jul 2005: House of Commons debates (TheyWorkForYou.com)
  36. Jump up^ Co-proxamol: 17 Jan 2007: Westminster Hall debates (TheyWorkForYou.com)
  37. Jump up^ Failure Of MHRA Coproxamol Named Patient System – Visitor Opinion
  38. Jump up^ News Centre : MHRA
  39. Jump up^ “FDA Takes Actions on Darvon, Other Pain Medications Containing Propoxyphene”.U.S. Food and Drug Administration (FDA). 7 July 2009.
  40. Jump up^ Drug Information for Darvocet-N 100 Oral – Web MD
  41. Jump up^ NCQA’s HEDIS Measure: Use of High Risk Medications in the Elderly
  42. Jump up^ Zajac, Andrew (November 19, 2010). “Darvon, Darvocet painkillers pulled from the U.S. market”. L.A. Times. Archived from the original on November 22, 2010. RetrievedNovember 19, 2010.
  43. Jump up^ Health Canada: Darvon-N (dextropopoxyphene) – Recall and Withdrawal in Canada
  44. Jump up^ The Hindu: Govt. bans painkiller
  45. ^ Jump up to:a b Nitschke, Philip; Fiona Stewart (2006). The Peaceful Pill Handbook. U.S.: Exit International. ISBN 0-9788788-1-7.
  46. Jump up^ Pieter Admiraal; et al. Guide to a Humane Self-Chosen Death. The Netherlands: WOZZ Foundation, Delft. ISBN 90-78581-01-8.
  47. Jump up^ ASH Wiki: Darvon Cocktail
Cited Patent Filing date Publication date Applicant Title
US4661625 * Dec 2, 1985 Apr 28, 1987 Mallinckkodt, Inc. Synthesis and purification of d-propoxyphene hydrochloride
Reference
1 * Journal of the American Chemical Society, Volume 77, No. 12, 28 June 1955, American Chemical Society, (Washington, US) A. POHLAND et al.: “Preparation of alfa-d- and alfa-l-4-Dimethylamino-1,2-Diphenyl-3-Methyl-2-Propionyloxy-Butane“, pages 3400-3401
Dextropropoxyphene
Dextropropoxyphene structure.svg
Dextropropoxyphene3DanJ.gif
Systematic (IUPAC) name
(1S,2R)-1-benzyl-3-(dimethylamino)-2-methyl-1-phenylpropyl propionate
Clinical data
Trade names Darvon
AHFS/Drugs.com Monograph
MedlinePlus a682325
License data
Pregnancy
category
  • AU: C
Routes of
administration
oral, IV, rectal
Legal status
Legal status
Pharmacokinetic data
Bioavailability 40%[1]
Protein binding 78%[1]
Metabolism Liver-mediated, CYP3A4-mediated N-demethylation (major), aromatic hydroxylation (minor) and ester hydrolysis (minor)[1]
Biological half-life 6–12 hours; 30–36 hours (active metabolite, nordextropropoxyphene)[2]
Excretion Urine (major), breastmilk (minor)[1]
Identifiers
CAS Number 469-62-5 Yes
ATC code N02AC04 (WHO)
PubChem CID 10100
IUPHAR/BPS 7593
DrugBank DB00647 
ChemSpider 9696 Yes
UNII S2F83W92TK Yes
KEGG D07809 Yes
ChEBI CHEBI:51173 Yes
ChEMBL CHEMBL1213351 Yes
Chemical data
Formula C22H29NO2
Molar mass 339.471 g/mol


///////////

CCC(=O)OC(CC1=CC=CC=C1)(C2=CC=CC=C2)C(C)CN(C)C

Share

11th Pharmacovigilance 2016, 1st Dec 2016, Kohinoor Continental Hotel, Mumbai, India

 CONFERENCE, Uncategorized  Comments Off on 11th Pharmacovigilance 2016, 1st Dec 2016, Kohinoor Continental Hotel, Mumbai, India
Oct 052016
 

str1  str3

11th Pharmacovigilance 2016

“Ensuring safer drugs to market by analyzing latest developments in pharmacovigilance, drug safety and risk management”

1st December 2016, Kohinoor Continental Hotel, Mumbai, India

After the successful journey of a series of 10 Pharmacovigilance conferences, Virtue Insight is proud to announce its 11th Pharmacovigilance 2016 in India. It is our great pleasure to invite you to the 11th Pharmacovigilance 2016, in Mumbai – India on 1st of December 2016. We have a wide range of scientific topics with something for everyone.

The past is reflected in a session about Indian traditional medicine and the future is discussed under Big Data analytics and in the research of our young scientists. However, we must live and act in the present and debate pressing challenges that face us today in pharmacovigilance (PV). The rates for medication errors are too high. We still struggle to communicate risk well. With the welcome drive towards transparency and respecting human rights, legal and ethical issues in PV have come to the fore. Society’s research enterprise as a whole needs to become far more aware of the commercial reality that PV underpins safety, with its intimate links to innovation, so that safety and must be intrinsically built into successful development and marketing. With governments round the world struggling to curb healthcare costs, the importance of integrating PV into National Health Programmes has never been more important.

It gives me great pleasure in welcoming all of you to the virtue insight’s 11th Pharmacovigilance 2016. I wish and pray that all our efforts will be beneficial to our industries and to our country at large.

str2

pic KANCHI SHAH, VIRTUEINSIGHT


KEY SPEAKERS INCLUDE

JEAN CHRISTOPHE DELUMEAU, Head of Pharmacovigilance Asia-Pacific, Bayer HealthCare (Singapore)

Jean-Christophe Delumeau


JESSICA THONGCHAREN, Associate Director Pharmacovigilance, Takeda Pharmaceuticals (Singapore)

 Jessica Thongcharen

ARUN BHATT, Consultant – Clinical Research & Development
V. KALAISELVAN, Principal Scientific Officer, Indian Pharmacopoeia Commission, Ministry of Health & Family Welfare, Govt. of India
SUDHIR PAWAR, Coordinator – ADR monitoring Center at LTMMC & GH, Under Pharmacovigilance Programme Of India (PvPI),Indian Pharmacopoeia Commission
ARUN BHATT, Consultant – Clinical Research & Development
BHASWAT CHAKRABORTY, Senior VP & Chair, Research and Development Core Committee, Cadila
SUTAPA B NEOGI, Additional Professor, Indian Institute of Public Health
DEEPTI SANGHAVI, Assistant Manager – Medical Writing, Tata Consultancy Services
JAMAL BAIG, Country Head – Pharmacovigilance, Merck
SIDDHARTH DESHPANDE, Assistant Professor Department of Clinical Pharmacology, KEM Hospital
ABHAY CHIMANKAR, Head, Global Drug Safety, Cipla
SANDESH SAWANT, Head, Clinical Operations (India and EM), Wockhardt
ABHAY PHANSALKAR, Head Clinical Trials, Cipla
GURPREET SINGH, Head Vendor Management, Drug Safety & Epidemiology, Novartis
MILIND ANTANI, Partner In-Charge – Pharma LifeSciences, Nishith Desai Associates
VARSHA NARAYANAN, Head Medical Affairs, Wockhardt
POOJA JADHAV, Manager, Sun Pharmaceuticals
GODHULI CHATTERJEE, Senior Medical Advisor and Clinical Safety Officer, Sanofi-aventis

Plus Many More..

PEOPLE YOU GET TO MEET

Vice Presidents, Directors, CRO’s, Heads and Managers of:
Pharmacovigilance Strategy, Drug Safety/Risk Management, Information and Clinical Data Management, Clinical Research, Research & Development, Product Safety/Assurance Assessment, Patient Safety & Outcomes Research & Data Analysis, Epidemiology project management, Regulatory Affairs and Compliance, Sales & Marketing, Biotech manufacturers

FROM VARIOUS

Pharmaceutical organizations, Generic pharmaceutical companies, Contract research organizations, Patient recruitment companies, Government- Department of health, Non-profit organizations/ Association, Consultants
This event also serves as a platform for networking opportunities in the relevant field , wherein you get to meet and  broaden  your  contacts to develop your business. We also have sponsorship opportunities available for the event which gives you an opportunity to speak/exhibit and create brand awareness. Or you could even attend the event as a delegate and get a better insight of the updates and  the increasing challenges in the industry . So hurry now and be a part of this massive event.


GLIMPSES OF MY( DR ANTHONY) INTERACTION

str2

with Fen Castro of VirtueInsight, Director , and his team , , —thanks for inviting me to 9th Biosimilars Congregation 2016., Lalit hotel, Mumbai, India, 22nd Sept 2016 — with Fen Castro, Kanchi Shahand Virtue Insight at The Lalit Hotel.


CONFERENCE BOOKING DETAILS

Online Registration http://www.bookmytrainings.com/all-courses/professional-events/event/44991-11th-pharmacovigilance-2016
Early Bird Discount Price – 1 Delegate Pass (INR 6,000 + Tax (15%) – Book and Pay before 17th October 2016 to avail this price
Standard Price (From 18th October 2016) – 1  Delegate Pass – (INR 7,000 + Tax (15%)
Group Discounts (Applicable for 3 or 4) – 1 Delegate Pass  – (INR 6,500 + Tax (15%)
Group Discounts (Applicable for 5 or more) – 1 Delegate Pass  – (INR 6,000 + Tax (15%)
Conference Sponsor & Exhibition Stall – Should you wish to Sponsor, Exhibition Stall (Booth) or a paid Speaker Slot, you can simply call or email your interest and queries to TEL: +91 44 64614333, or sponsor@virtueinsight.com

str2

REGISTRATION PROCESS

In order to register simply email the below mentioned details to delegate@virtueinsight.com

  • Company Name & Address
  • Attendee Name/Names
  • Job Title
  • Contact Number

We also have some sponsorship opportunities available for the event, which gives you an opportunity to speak/exhibit, and create brand awareness. In addition, the networking opportunities in focused and relevant industry gathering provide the personal contact necessary for business development efforts.

In case you or any of your colleagues might be interested in participating in the same, please let us know and we will be happy to call you and help you with the registration.


SEE BROCHURE

Image result for waitALLOW BROCHURE TO LOAD

str3

Thank you for your time and consideration.

Fen Castro

Head – Productions

Virtue Insight

Image result for FEN CASTRO

Tel (India) –       + 91 44 64614333

Mobile (India) –  + 91 9003 26 0693

Tel (UK) –          + 44 2036120886


////////////11th Pharmacovigilance,  2016, 1st Dec,  2016, Kohinoor Continental Hotel, Mumbai, India, Conference, fen castro

Share

Bromoclenbuterol

 Uncategorized  Comments Off on Bromoclenbuterol
Oct 042016
 

Bromoclenbuterol.png

Bromoclenbuterol

Bromoclenbuterol; CAS 37153-52-9; Chlorbrombuterol; AC1MC7W8;
Molecular Formula: C12H18BrClN2O
Molecular Weight: 321.64112 g/mol


CLIP

http://dx.doi.org/10.1016/j.chroma.2012.08.031

Volume 1258, 5 October 2012, Pages 55–65

Wide-range screening of banned veterinary drugs in urine by ultra high liquid chromatography coupled to high-resolution mass spectrometry

  • a Center for Public Health Research (CSISP), Avda de Cataluña 21, 46020 Valencia, Spain
  • b Thermo Fisher Scientific, Barcelona, Spain
  • c Analytical Chemistry Department, Universidad de Valencia, Edifici Jeroni Muñoz, 50, Dr. Moliner, 46100 Burjassot, Valencia, Spain


CLIP

Synthesis and Characterization of Bromoclenbuterol

Ravi Kumar Kannasani*, Srinivasa Reddy Battula, Suresh Babu Sannithi, Sreenu Mula and Venkata Babu VV

R&D Division, RA Chem Pharma Limited, API, Hyderabad, Telangana, India

*Corresponding Author:
Ravi Kumar Kannasani
R&D Division, RA Chem Pharma Limited
API, Prasanth Nagar, Hyderabad, Telangana, India
Tel: +919000443184
E-mail: kannasani.ravi@rachempharma.com

http://www.omicsonline.org/open-access/synthesis-and-characterization-of-bromoclenbuterol-2161-0444-1000397.php?aid=79341

Citation: Kannasani RK, Battula SR, Sannithi SB, Mula S, Babu VVV (2016) Synthesis and Characterization of Bromoclenbuterol. Med Chem (Los Angeles) 6:546-549. doi:10.4172/2161-0444.1000397


4-Amino acetophenone (1) was reacted with N-Chlorosuccinimide in 1N HCl to afford 4-amino-3-chloro acetophenone (7), which was reacted with bromine to give 1-(4-amino-3-bromo-5-chlorophenyl)- 2-bromoethanone (8). The obtained bromo compound was reacted with tertiay -butyl amine to afford 2-(tert-butylamino)-1-(4-amino-3- bromo-5-chlorophenyl)ethanone (9), which was reduced with sodium borohydride in methanol to give bromoclenbuterol compound (10). The synthesized bromoclenbuterol structure was confirmed by 1H NMR, 13C NMR, IR and mass spectra.

1-(4-Amino-3-chlorophenyl)ethanone (7)

To a stirred solution of 1N HCl (1500 ml) was added 4-amino acetophenone (1) (200 gm, 1.48 mole) and N-Chloro succinimide (50 gm, 0.37 mole) at room temperature, and stirring continued for 3 hrs at 25-30°C. After maintenance undissolved material was filtered from the reaction mixture, total filtrate was taken and extracted with ethyl acetate, dried over sodium sulfate and evaporated under vacuum to get crude. Crude material was dissolve in ethyl acetate, titrated with EA-HCl and stirred for 15-30 min to get precipitation. The obtained precipitate was filtered and washed with ethyl acetate, and this acidic titration operation was repeated 2 times to get mono chloro compound as solid material, this solid material was neutralized with sodium carbonate solution in aqueous condition and further purified by using recrystlliaztion technique in ethyl acetate to get 68 gm (yield-27%) 3-chloro-4-amino acetophenone (7) (mono chloro compound), as light brown colored solid with 98.66% HPLC purity (124 gm of unreacted 4-amino acetophenone obtained from aqueous layer).

1-(4-Amino-3-bromo-5-chlorophenyl)-2-bromoethanone (8)

To a stirred solution of 3-chloro-4-amino acetophenone (7) (14 gm, 0.082 mole) in chloroform (140 ml) was added bromine (26.24 gm, 0.164 mole) solution slowly at 25-30°C and stirring continued for 6 hrs at same temperature. After completion of the reaction, methanol was added to the reaction mixture and continued the stirring for 30 min at RT. Undissolved material was filtered, the filtrate was distilled up to 50%, remaining mass was cooled to 0-5°C and filtered to give 15 gm (yield-55%) of 1-(4-amino -3-chloro-5-bromo – phenyl) -2-bromo ethanone (8) as light brown color solid with 95.15% HPLC purity.

2-(Tert-butylamino)-1-(4-amino-3-bromo-5-chlorophenyl) ethanone (9)

To a stirred solution of 1-(4-amino -3-chloro-5-bromo – phenyl) -2-bromo ethanone (8) (8 gm, 0.024 mole) in chloroform (50 ml) was added catalytic amount of potassium iodide (0.1 gm, 0.0006 mole) and tertiary butyl amine (5.2 gm, 0.072 mole) at 0-5°C and stirring was continued for 24 hrs at 0-5°C. After completion of the reaction, undissolved salts were filtered, the filtrate was distilled under vacuum to get crude solid material, which was triturated with hexane to give 6 gm (yield-76%) of 1-(4-amino-3-chloro-5-bromo phenyl)-2-[(1,1- dimethylethyl)amino]ethanone (9) as light pale yellow color solid.

(S)-2-(Tert-butylamino)-1-(4-amino-3-bromo-5- chlorophenyl)ethanol (10)

To a stirred solution of 1-(4-Amino-3-chloro-5-bromo phenyl)- 2-[(1,1-dimethylethyl)amino]ethanone (9) (6 gm, 0.018 mole) in methanol (25 ml) was added sodium borohydride (0.7 gm, 0.018 mole) at 0-5°C. After addition, reaction mixture was slowly allowed to come to room temperature and stirred for 10 hrs at 25-30°C. On completion, reaction mixture was poured in to chilled water, obtained precipitate was filtered, dried and recrystallized in methanol to give 5 gm (yield-82%) of 1RS-1-(4-amino -3-bromo-5-chloro phenyl) -2-[(1,1-dimethyl ethyl)amino ethanol (or) Bromo clenbuterol (10) as off-white solid. HPLC purity-98.80%,

1H NMR (CDCl3): δ 7.35 (d, 1H, J=1.2 Hz), 7.23 (d, 1H, J=1.6 Hz), 4.45 (br s, 2H), 4.42 (dd, 1H, J=9.2, 3.6 Hz), 2.84 (dd, 1H, J=11.6, 3.6 Hz), 2.50 (dd, 1H, J=12.0, 9.2 Hz), 1.10 (s, 9H).

13C NMR (CDCl3): 140.12, 133.93, 128.46, 126.05, 119.16, 109.08, 70.94, 50.33, 50.05, 29.15.

IR (KBr, Cm-1): 3465.99, 3320.19, 2965.04, 1623.40, 1483.88, 1219.17, 758.77, 630.41.

Mass: (m/z)-323.01 (M+2 peak).


References


////////////

Share

Wanbury successfully completes USFDA inspection at its API facility in Patalganga Plant (01-Oct-2016)

 Uncategorized  Comments Off on Wanbury successfully completes USFDA inspection at its API facility in Patalganga Plant (01-Oct-2016)
Oct 032016
 

Image result for wanbury

Wanbury has successfully completed US Food and Drug Administration (USFDA) inspection a at its API facility in Patalganga Plant, Maharashtra. The audit was carried out for a period of 4 days from September 26 to September 29, 2016 and concluded successfully. This is the second plant to be approved by USFDA this year, as earlier Tanuku Plant got approval two months ago in July 2016.

Wanbury, one of India’s fastest growing pharmaceutical companies amongst the ‘Top 50 Companies’ in India (as per ORG-IMS), has a strong presence in API global market and domestic branded Formulation. The company’s major thrust area lies in Active Pharmaceutical Ingredient (API) sale in over 70 countries and Pan-India Formulation presence.

str1

Image result for wanbury

Image result for wanbury

Mr. K. Chandran, Wholetime Director & Vice Chairman

Image result for wanbury

MR K. CHANDRAN (left), Director, Wanbury, and Mr Asok Shinkar

Patalganga Plant
US FDA approved plant is located at Kaire Village, Taluka: Khalapur, District: Raigad, Maharashtra State. It is situated in Maharashtra Industrial Development Corporation (MIDC), a Govt. notified industrial park for chemical manufacturing. The site is located 80 kilometers south of Mumbai International Airport and is easily accessible by road.

//////////Wanbury, USFDA inspection,  API facility, Patalganga Plant

Share
Follow

Get every new post on this blog delivered to your Inbox.

Join other followers: