QBD, Analytical Quality by Design

The presentation will load below


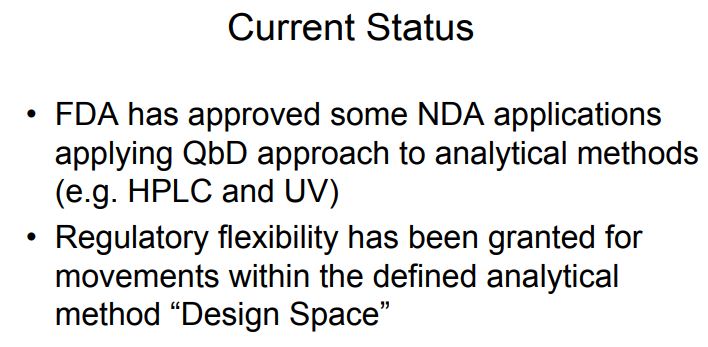
Very recently, Food and Drug Administration (FDA) has approved a few new drug applications (NDA) with regulatory flexibility for quality by design (QbD) based analytical approach. The concept of QbD applied to analytical method development is known now as AQbD (analytical quality by design). It allows the analytical method for movement within method operable design region (MODR). Unlike current methods, analytical method developed using analytical quality by design (AQbD) approach reduces the number of out-of-trend (OOT) results and out-of-specification (OOS) results due to the robustness of the method within the region. It is a current trend among pharmaceutical industry to implement analytical quality by design (AQbD) in method development process as a part of risk management, pharmaceutical development, and pharmaceutical quality system (ICH Q10). Owing to the lack explanatory reviews, this paper has been communicated to discuss different views of analytical scientists about implementation of AQbD in pharmaceutical quality system and also to correlate with product quality by design and pharmaceutical analytical technology (PAT).
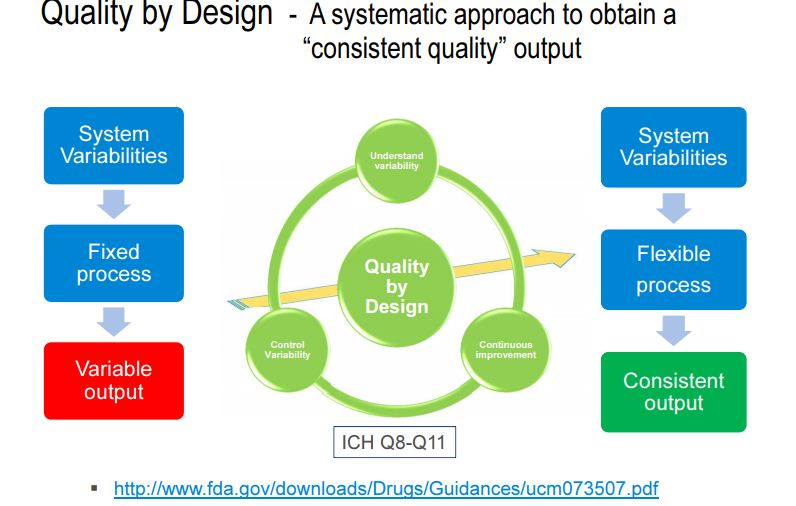
The concepts described in ICH Q8-Q11, commonly referred to as Quality by Design (QbD), have also been applied to the development of analytical methods. An overview of these concepts using the development of a reversed-phase liquid chromatography assay and related substances drug product method is provided. The benefits of applying QbD principles to analytical methods include identifying and minimizing sources of variability that may lead to poor method robustness and ensuring that the method meets its intended performance requirements throughout the product and method lifecycle.
Introduction
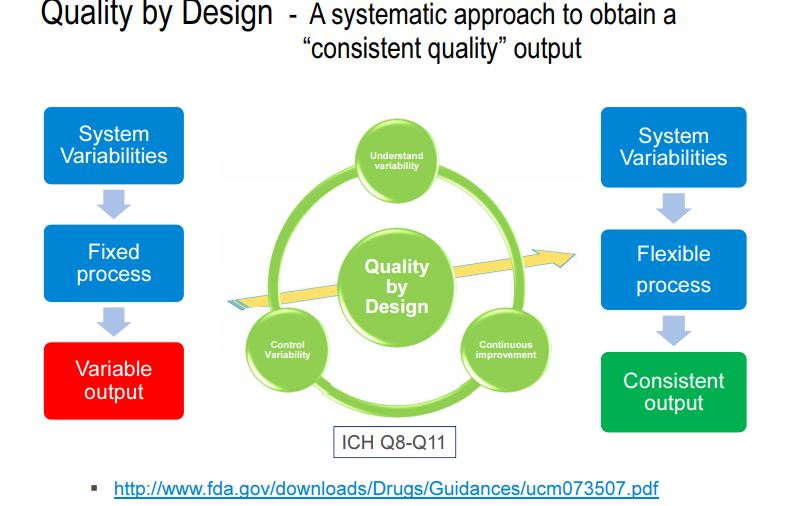
The concept of quality by design (QbD) in pharmaceutical industry has been introduced to enhance robust manufacturing process, to facilitate product quality, and to manufacture products in terms of “six sigma.” The PUCC (process of understanding the control and capability) is a loop process, implemented for continuous improvement. “Six sigma” is a system of practices developed for systematic improvement of processes, which eliminate the defects with statistical significance. Since it was originally developed, six sigma has become an important element of many total quality management (TQM) initiatives . The significant number of reports on out-of-trend (OOT) results, out-of-specification (OOS) results, out-of-control (OOC) and out-of-statistical-control (OOSC), indicating that the present system of pharmaceutical industry is not immune to these issues. Hence, pharmaceutical industries are striving for new strategy and/or new element which can be add/replace the existing elements of quality and risk management system. At this juncture, implementation of QbD has been made mandatory in some countries, especially by EMA (Europe Medicines Agency) and other ICH countries . International conference on hominization (ICH) Q8 (R1) guideline defines QbD as “a systematic approach to development that begins with predefined objectives and emphasizes product and process understanding and process control, based on sound science and quality risk management” . It implies that product and process performance characteristics need to be scientifically designed to fulfill the specific objectives but not based on performance of test or quality control of release batches.
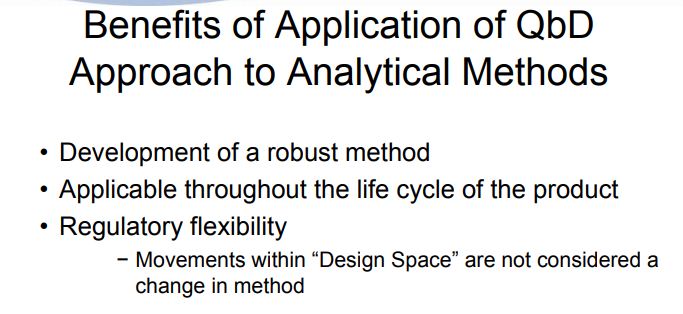
QbD concepts are well defined in ICH guidelines Q8 (R1): pharmaceutical development, Q9: quality risk management, and Q10: pharmaceutical quality system. There were few conferences, during late 2013 and early 2014, insisting on the implementation of the existing QbD concept to analytical method development . Several researchers reported that similar opportunities exist for applying QbD to analytical methods as they do for manufacturing processes . AQbD helps in development of a robust and cost effective analytical method which is applicable throughout the lifecycle of the product, to facilitate the regulatory flexibility in analytical method. It means the freedom to change method parameters within a method’s design space, referred to as the method operable design region (MODR) .
Among analytical researchers, to date there is no or negligible experience or exposure with the AQbD approach for analytical methods. As today, pharmaceutical industries have many questions and require a lot more discussions on implementation AQbD and its correlation with other components of pharmaceutical quality systems. Literature survey reveals that many researchers have adopted QbD principles to the development of analytical methods and they are termed analytical QbD (AQbD) . Certainly, most of works were not enough to define the way of implementation of AQbD, because people felt that implementation of DoE in analytical method is QbD and it is incorrect. Moreover these reports have reflected the inadequacy of knowledge on analytical target profile (ATP), method performance characteristics, risk assessment, choice of DOE tool in QbD process, optimization of MODR region and its verifications, and so forth.
We know that system suitability testing (SST) for an analytical method is required by USP and FDA to ensure ongoing performance of an analytical system and relevant methods. Very recently related chapters have been updated by United States Pharmacopoeia (USP-NF) and European Pharmacopoeia (EP) in which flexibility is granted for an analytical method that can be changed without the need for revalidation if AQbD approach has been implemented. The USP chapter makes a statement that SST can substitute an instrument’s performance qualification; however further guidelines are not given. So there are many questions which still exist among regulatory expertise, and thus the concept of QbD in analytical method development (to be termed as AQbD) became a continuing interest to discuss and to learn more.
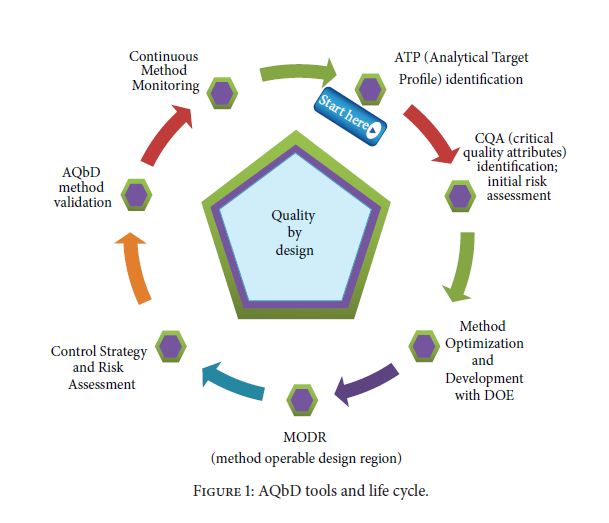
 Figure 1. AQbD workflow
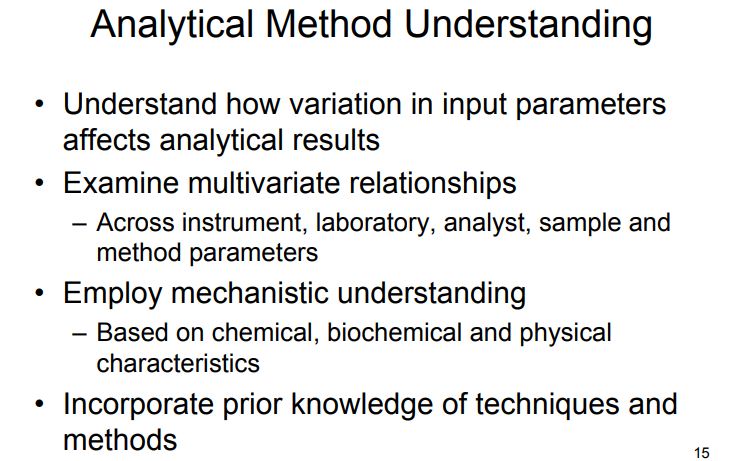
Quality by Design (QbD) is well established in the pharmaceutical industry for manufacturing processes (ICH Q8 [1] for pharmaceutical development and ICH Q11 [2] for development and manufacture of drug substances). QbD is “a systematic approach to development that begins with predefined objectives and emphasizes … understanding and … control, based on sound science and quality risk management” [1]. The outcome of using QbD concepts is a well-understood product and process that consistently delivers its intended performance. The knowledge obtained during development may support the establishment of a design space and determines suitable process controls. These same QbD principles have been applied to the development of analytical methods, and are termed “Analytical QbD” (AQbD) [3-20]. Analogous to process QbD, the outcome of AQbD is a well understood, fit for purpose, and robust method that consistently delivers the intended performance throughout its lifecycle. The broad knowledge obtained from this process is used to establish a method operable design region (MODR), a multidimensional space based on the method factors and settings that provide suitable method performance.
OFAT versus AQbD in Analytical Method Development
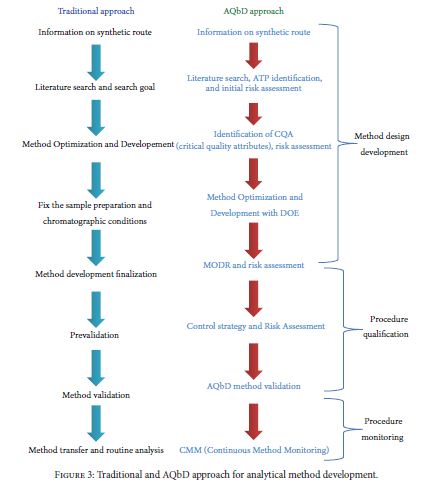
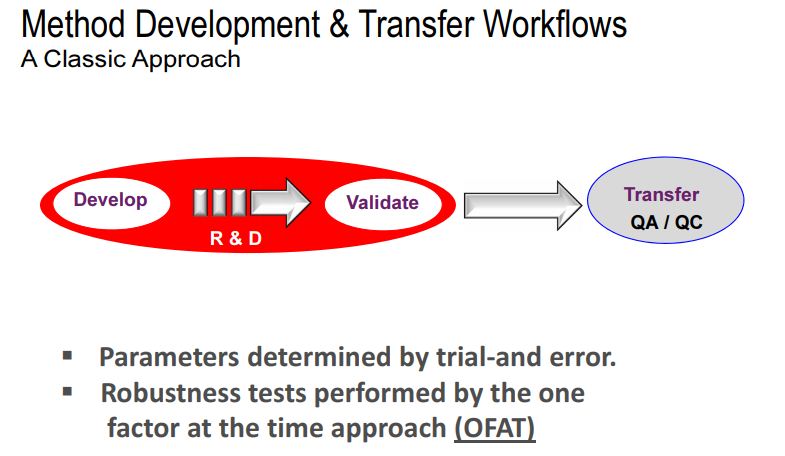
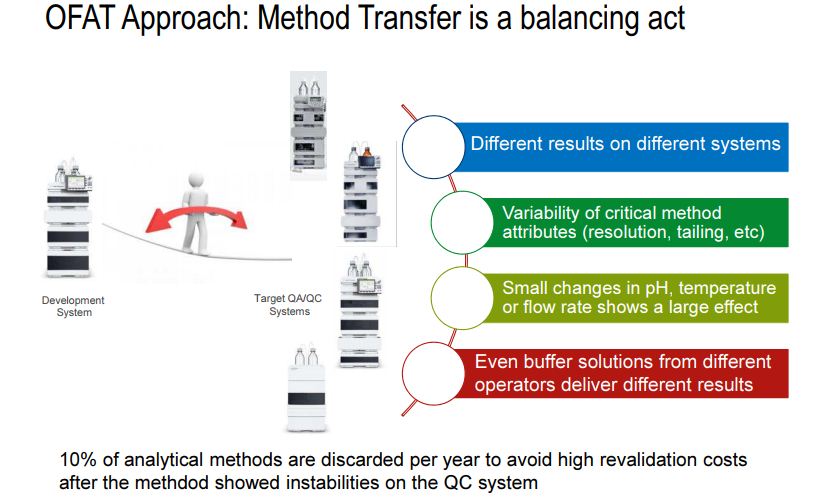
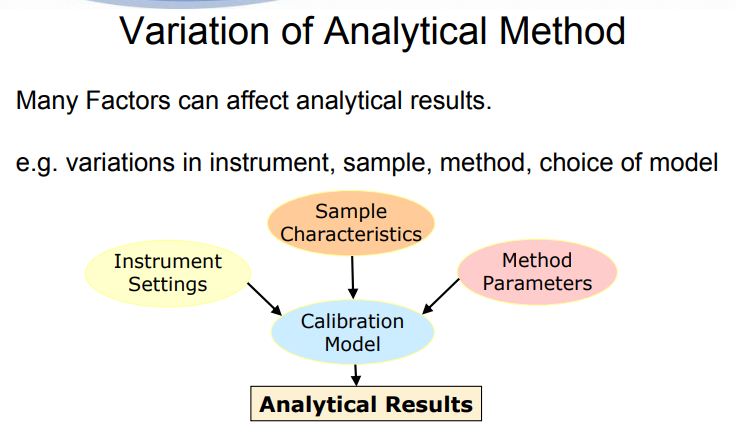
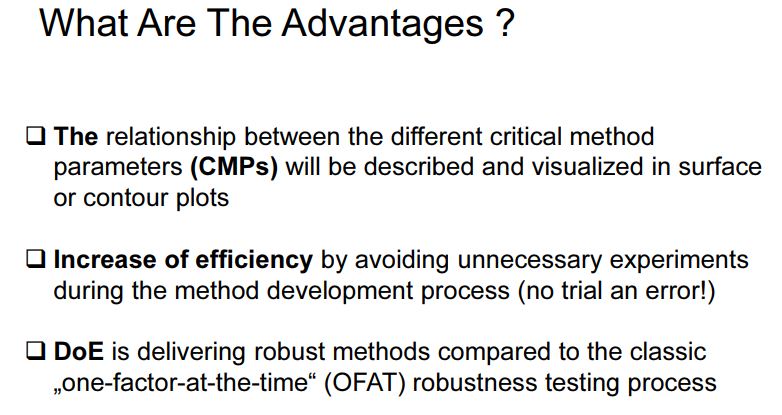
In present days, analytical method failure is becoming more common especially during method transfer as well as in quality control departments. It is presumed to be due to the exception given for robust test compliance by ICH Q2 guidelines. In current practices, chromatographic methods are more commonly employed as right analytics at all the stages during the product life cycle. Common analytical methods for content uniformity, assay, impurity profile, and stability indicating assay are based on high performance liquid chromatographic (HPLC) or ultraperformance liquid chromatographic (UPLC) or rapid resolution liquid chromatographic methods (RRLC). In connection with chromatography, due to complex parameters involved in the method development phase, low sensitivity, selectivity, and inadequate understanding between method performance and method parameters, always the revalidation protocol has been recommended in procedures. On the other hand, in current practice, the implemented analytical methods were based on one factor at a time (OFAT), in which one parameter alone is optimized for the expected response whilst others remained constant . This practice always yielded a narrow robust behavior of the method for instrumental variables used in method development phase. Hence the present strategy of analytical method (i.e., OFAT) development has high risk in method failure and always requires revalidation protocol after method transfer or alternative method development; thereby it has been increasing the cost of the method.
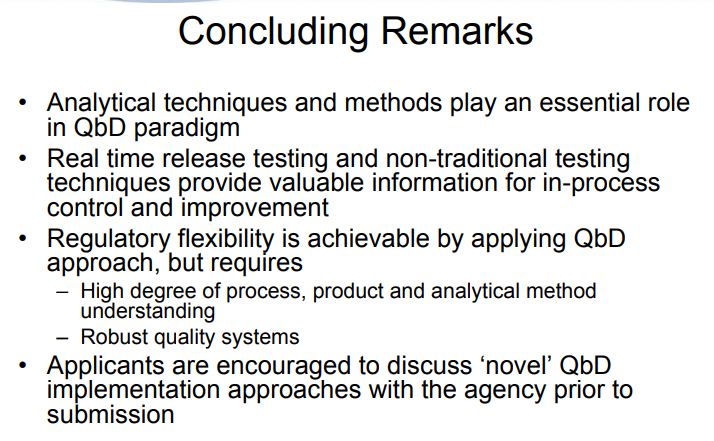
The AQbD explores scientific understanding in method implementation sequences and starts with product quality that relates the risk assessment in method choice and then between method parameter and expected method results and finally a region for high robust and cost effective approach. DoE is a part of AQbD, and it represents the interaction among the input variables that ultimately affect the method response and results. At this juncture, AQbD paradigm is a preferred and recommended strategy to be followed in analytical method development so as to attain regulatory flexibility and reduce OOS, OOT, OOC, and OOSC results, high degree of robustness and cost effective analytical method.
Analytical Target Profile (ATP)
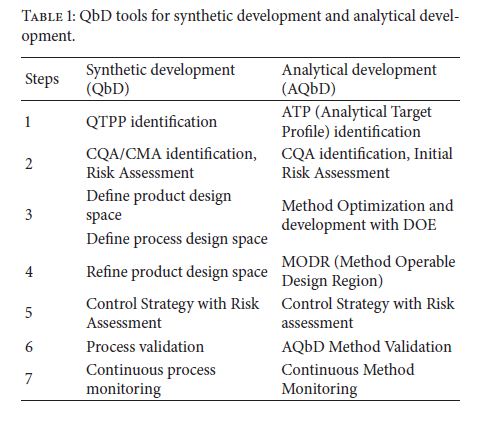
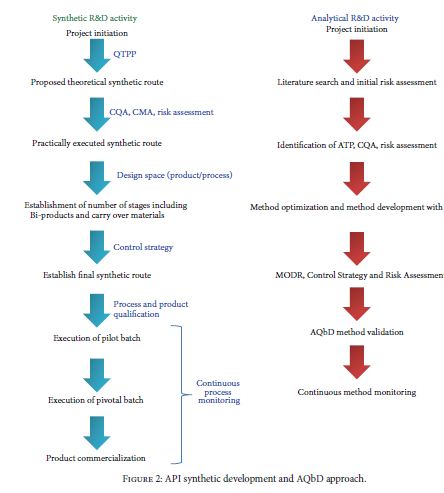
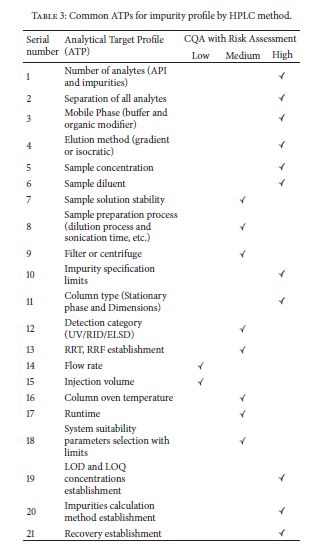
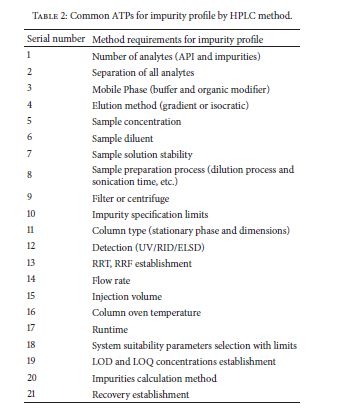
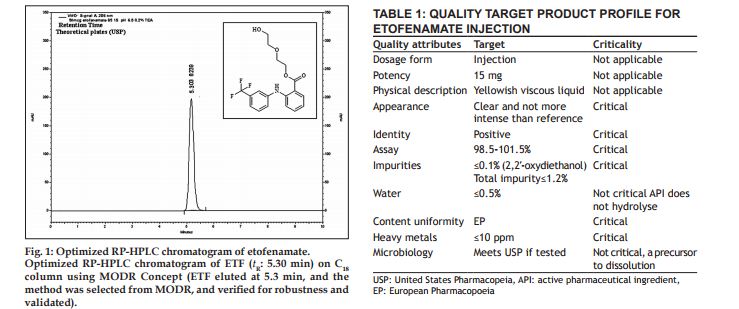
AQbD is started with an analytical target profile or ATP, which is an analogue to QTPP (Table 1). ATP defines the goal of the analytical method development process, relating the results of the method to achieve QTPP. Recently PhRMA and EFPIA provided the definition of ATP: “ATP is a statement that defines the method’s purpose which is used to drive method selection, design, and development activities.” ATP is a key parameter in AQbD that facilitates greater continuous improvement of analytical methods and their choice, once the regulatory authorities approve the ATP statement. In pharmaceutical industry, internal change control management system is responsible for effective implementation of ATP to provide regulatory flexibility
| Table 3: Implementation of analytical QbD in pharmaceutical quality system. | ||||||||||||||||||||||||||||||||||||||||||
|
||||||||||||||||||||||||||||||||||||||||||
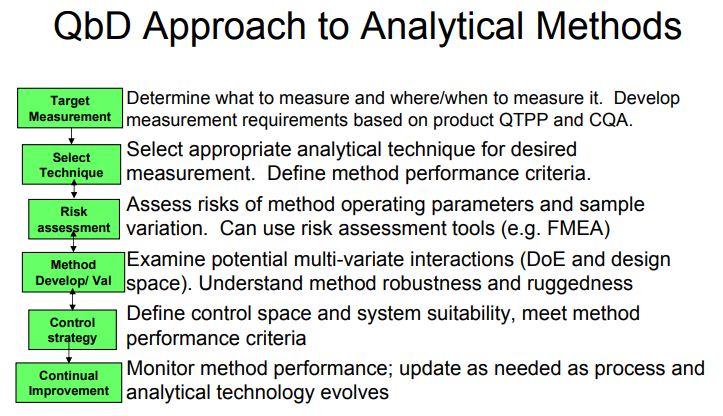
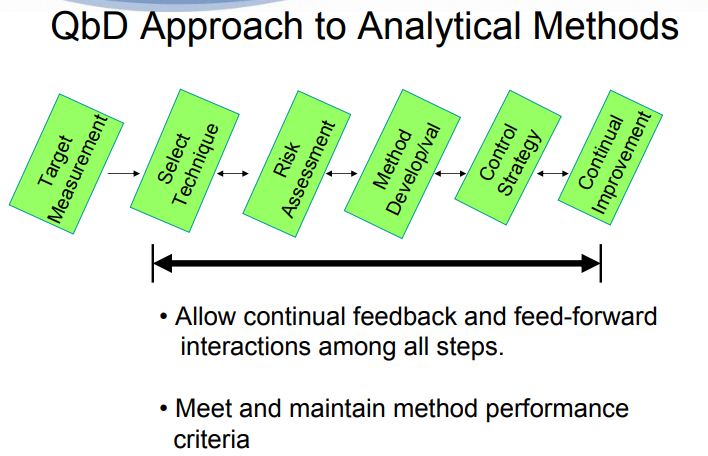
It is also used to establish meaningful method controls of which system suitability is one component. A high level overview of the AQbD steps is depicted in Figure 1.
This approach can be applied to any method development, though depending on the compound stage of development and method scope, the application of the steps may differ.
Method performance requirements:
Analytical target profile (atp) Once a measurement need is identified, method performance requirements are defined. Columns one and two in Table 1 list analytical method performance characteristics as defi ned in USPand ICH Q2(R1). Individually, these characteristics are not sufficient to assess the quality of reportable results or demonstrate that the method performance is appropriate for its intended use. This is because method performance is fundamentally comprised of both systematic (bias) and random (variance) components. An inspection of the definitions indicates a possible high-level categorization of the performance characteristics: accuracy, specifi city, and linearity measure systematic deviation from the true (known) reference value, and precision, detection and quantification limits are inherent measures of (random) dispersion. A categorization of the analytical method performance characteristics in terms of systematic and random components is shown in Table 1, column 3 [21].
Among these performance characteristics, accuracy and precision provide the critical information needed to quantify an unknown amount of the substance using the method. A method cannot be accurate and precise without adequate specifi city, linearity over a stated range, sufficient peak resolution for accurate integration, repeatability of injections, etc. These are important characteristics to evaluate during method development (and provide an extensive data set for setting method controls) as they lead to an accurate and precise method. However, these performance characteristics do not speak directly to the risk of making an ill-advised decision based upon the reportable result obtained from the method [22]. A joint measure of accuracy and precision, on the other hand, directly addresses this [23]. Range is an important component that is established based on acceptable behavior of both systematic and random performance characteristics, and robustness defines an operational range of method factors that will be illustrated in a later section.
The Analytical Target Profile (ATP) defines method performance requirements, and should incorporate a joint criterion for accuracy and precision in order to define method acceptability in terms of the uncertainty of results generated by the method. Other method performance characteristics (linearity, specificity, etc.) do not need to be incorporated in the ATP as they are not directly linked to understanding the agreement of a measurement with the true value. An assay ATP should include a statement of accuracy and precision as exemplified by:
“The procedure must be able to accurately and precisely quantify drug substance in film-coated tablets over the range of 70%- 130% of the nominal concentration with accuracy and precision such that reported measurements fall within ± 3% of the true value with at least 95% probability.”
By including a probability statement in the ATP, the risk of making ill-advised decisions from results will be controlled. The uncertainty range (± 3%) and probability (95%) are established based on a predetermined acceptable level of risk of making an incorrect decision with the data. For example, consider the result of a potency assay of 98.0% label claim for a lot to be released against a lower specification of 95.0% label claim. If the potency method has been verified to adhere to the above ATP statement (measurements fall within ± 3% of the true value with at least 95% probability), the risk that the true lot potency is out of specification (< 95.0% label claim) is less than 5%. (Note that the true lot potency will always be unknown.) That is, the potency method provides a result that ensures the true assay value is ± 3% of the reported value (98.0% ± 3%; or 95.0%-101.0%) with at least 95% probability; or there exists less than 5% ([1-0.95]*100) chance that the true assay value is101.0%.
The ATP shown here is not linked to a specific type of analytical methodology, therefore any type of technology or technique can be used if it is shown to meet ATP requirements.
Factors for identifying a measurement technique
The next step is to identify an analytical technology for performing the measurements that has the ability to conform to the ATP. The technique to be selected must be available at both development and transfer sites, and have staff expertise in its routine operation and maintenance. Analytical technologies are wide and diverse, and although much overlap in applicability exists, each technique has strengths and weaknesses. Significant general [24-27] and technique-specific [28-31] literature is available. Typical methods that are transferred include those for identity (e.g., raw material, excipient, drug substance, dosage form), assay (e.g., API assay, dosage form potency/content uniformity, blend composition, dissolution), purity (e.g., process related, stability related, heavy metals, solvent, water), bio-performance (e.g., dissolution, disintegration, hardness, particle size), form, and many other product-specific methods. One factor that must be considered from the onset is if the method will be on-line/at-line (in the manufacturing area) or off -line (in the lab). Factors to consider for this decision include the method purpose, method type, cycle time, worker safety, range and specificity (the latter two factors will help determine up-front if the method will have suitable accuracy and precision to meet the ATP). On-line analytical tools are routinely used during process development and manufacture [32]. However, in most cases, these (mainly spectroscopic) methods must be compared to a “primary” analytical methodology for quantitative measurements.
 Figure 2. Reversed-phase method development workflow
Although a number of separation technologies (gas, liquid, supercritical fluid, and thin layer chromatography, capillary electrophoresis and subsets of) are readily amenable for small-molecule pharmaceutical analysis, the most prevalent separation technique is reversed-phase liquid chromatography (RPLC). The high dynamic range and low variability of liquid chromatographic instruments coupled with the compatibility of most formulations and active pharmaceuticals leads to a majority of assay and related substances methods using RPLC.
Reversed-phase method Development Workflow
Figure 2 depicts the workflow used for RPLC methods development. The process involves four steps (Waves 0-4) [15].
For identified components, Log D as a function of pH is determined in silico and plotted. This plot is used to identify pH ranges that are predicted to provide stable component retention times with small changes in pH. If the components are not identified, the full wave 1 screen is run. In this screen, chromatographic performance is determined across a range of pH, two organic modifiers and several stationary phases. At the end of wave 1, the organic modifier and column are set. In wave 2, a pH screen around the pH identified in wave 1 is performed, and the pH is established. To identify optimum chromatographic conditions from the method development screen, a temperature and gradient experiment is performed (wave 3). The method’s chromatographic conditions are tentatively established using optimization software and are subsequently experimentally verified. These draft chromatographic conditions are evaluated for a period of time to gain hands-on experience prior to performing the next step, a method risk assessment.
Risk assessments
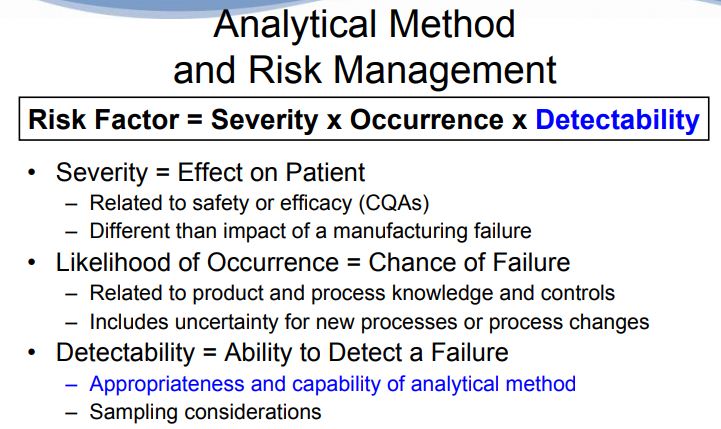
Quality Risk Management (ICH Q9) is “a systematic process for the assessment, control, communication and review of risks to the quality … across the … lifecycle” [33]. Risk assessments are an integral part of the Analytical QbD process. Their use facilitates identification and ranking of parameters that could impact method performance and conformance to the ATP. Risk assessments are often iterative throughout the lifecycle of a method, and are typically performed at the end of method development, with product changes (e.g., route, formulation or process) and as a precursor to method transfer. Risk assessments at the development to commercial transfer stage typically focus on parameters from a ruggedness perspective. These RAs focus on potential differences (e.g., laboratory practices, environment, testing cycle times, reagents sources). Major differences (e.g., equipment availability) should be identified and factored in at the technique selection and method development stages.
Table 2. Analytical Method Deconstruction
 Zoom In
AQbD risk assessments start with deconstructing the analytical method into Analytical Unit Operations. Unit operation Inputs and the Analytical Actions related to the particular process steps are identified. Parameters associated with the Analytical Actions are determined and Attributes of the respective Analytical Unit Operation are correspondingly identified and documented. An abbreviated method deconstruction example for sample preparation is listed in Table 2.
 Zoom In
Figure 3. RPLC potency and related substances method unit operation process flow diagram
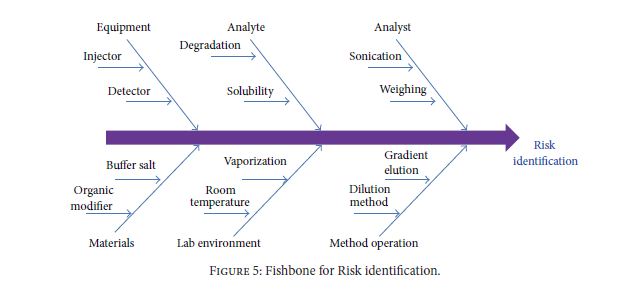
The resultant information generated from the method breakdown can be visualized with commercially available software in a multitude of ways (e.g., Fish Bone, Process Flow Diagrams). A process flow diagram for the Analytical Unit Operations of a potency and related substance RPLC method is illustrated in Figure 3.
 Zoom In
Figure 4. Chromatographic separation and analysis unit operation process flow diagram
A representative process flow diagram depicting the analytical actions associated with the chromatographic separation and analysis unit operation is shown in Figure 4.
Table 3. C&E Risk Assessment for a Chromatographic Separation
 Zoom In
Risk matrices are utilized to assess parameter risks with respect to the relevant attributes (e.g., accuracy, precision, resolution, tailing). During early development, simple matrices built from scientific knowledge and experience of the methodology may be utilized (e.g. Excel® based risk matrices). As programs progress in development, the use of more detailed matrices (e.g., Failure Mode Effects Analysis (FMEAs), Cause and Effect (C&E) Analysis) can facilitate the identification of high risk method parameters (factors) and attribute responses for subsequent experimentation to ensure that they do not impact the method’s ability to meet the ATP. An example risk assessment, based on a C&E matrix approach, for a chromatographic separation and analysis (Figure 4) is listed in Table 3. The component attributes are correlated to accuracy and precision aspects of the ATP, which are jointly assessed.
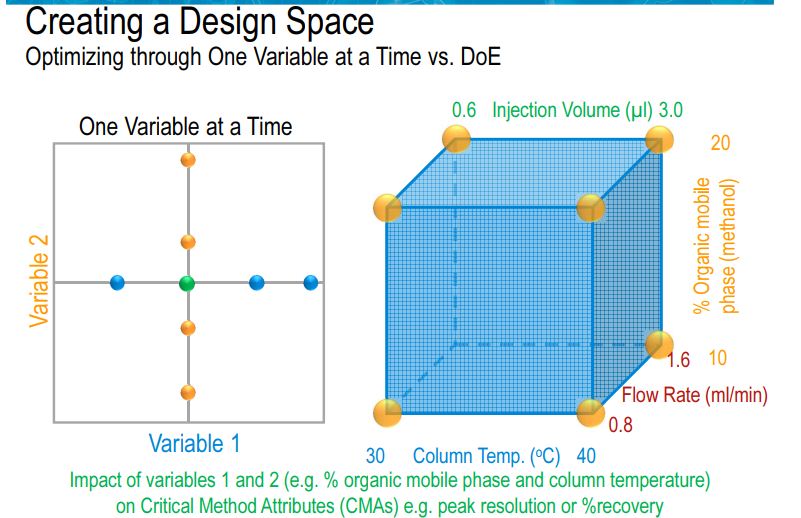
Design of experiments (Does)
Design of Experiments
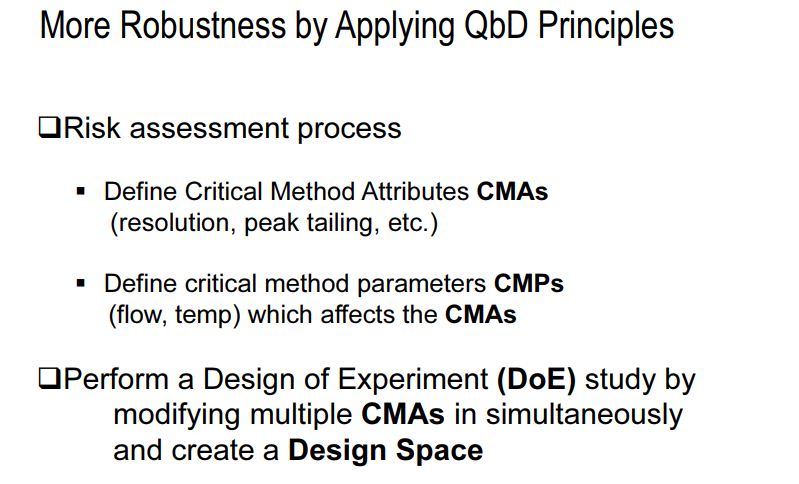
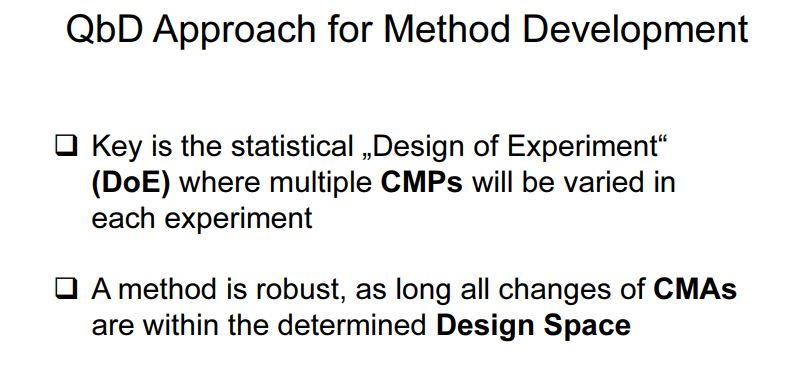
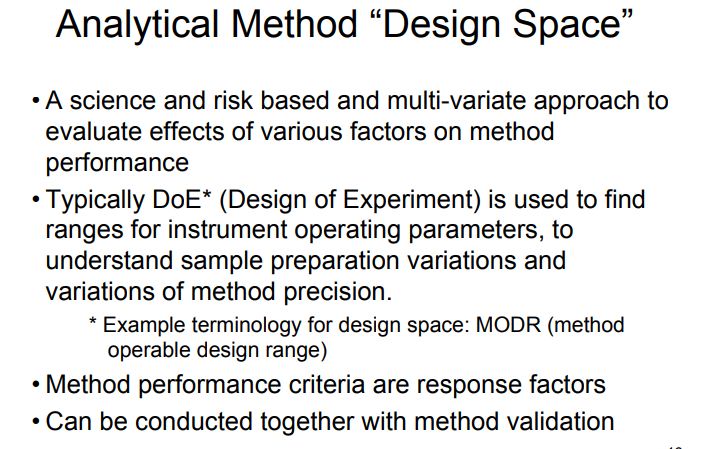
In accordance with the requirement of ICH Q8 guidelines, regarding “design space” in product development, method operable design region (MODR) can also be established in method development phase, which could serve as a source for robust and cost effective method. MODR is the operating range for the critical method input variable (similar to CQAs) that produces results which consistently meet the goals set out in the ATP. MODR permits the flexibility in various input method parameters to provide the expected method performance criteria and method response without resubmission to FDA. It is based on a science, risk based and multivariate approach to evaluate effects of various factors on method performance. FDA has suggested conducting MODR together with method validation as most recommended. Once this is defined, appropriate method controls can be put in place and method validation can be carried out. There are many analytical works which have been reported using experimental design based on factorial or fractional factorial design or response surface methodology. But those works were limited to the development of mathematical models to correlate input variables and output responses . The implementation of DoE in method development phase requires a huge understanding in selection of input variables and output response. DoE in AQbD approach includes the following.
Experimental investigations could be one factor at a time (OFAT: often used to assess noise factors such as column age or column lot number) or multi-factor statistical design of experiments (DOEs). An example of the parameters and attribute responses for investigating a chromatographic assay and related substance method is presented in Table 4. A statistician can facilitate the selection of an appropriate statistical design (along with analyzing the response information generated from the executed design) for the chosen parameters utilizing statistical software to minimize the analyses required while maximizing the information obtained.
Selection of DOE Tools
During the optimization, many approaches can be used to derive a mathematical relationship (model). The decision on selection of tool for DoE has to be made based on the number of input variables, knowledge on controlled parameters, and scientific understanding between result and variable (if any). Statistical knowledge is prime importance to interpret the interaction and contribution of variables in method responses , serving as a tool to select the variables at optimum levels. For example, if the effect of all input variables and their interactions are to be measured, factorial design can be applied then it can be considered and optimized with RSM (response surface methodology). Taguchi method can be used with lower number of experimental runs compared to factorial designs (say, 50%, 25%, etc.) but the interactions confounded need to be resolved. Where large numbers of input variables are to be studied without interaction effects, Plackett-Burman methods can be used. A typical selection of techniques is shown in Table xxx .
| Table xxx: Selection of DOE tools in analytical quality by design. | ||||||||||||||||||||||||||||||||||||||||||||||||
|
||||||||||||||||||||||||||||||||||||||||||||||||
Table 4. Experimental DoE Parameters and Attribute Responses for a RPLC Method
Once the data has been obtained, compiled, and processed, and appropriate response models have been determined, statistical numeric and graphical optimization tools can facilitate the simultaneous optimization of the multiple responses. The numeric optimization tool can allow identification of factor settings that result in optimal desirability [34] with respect to goals (e.g., to maximize resolution, theoretical plates; to minimize run time, tailing), high and low limits, weightings, and importance rankings applied to the relevant factors and/or responses. Numeric optimization is a mathematical approach for identifying an optimal “sweet spot” within the experimental space evaluated. Graphical optimization, allows application of factor and response limits, but relies on user intervention through iterative analysis to identify acceptable performance regions. For a chromatographic separation focus area, where the goal is to establish acceptable component detection (signal-noise and tailing) and separation (retention and resolution), these numeric and graphical response limits are estimates that facilitate identification of factor combinations (discrete points or regions and associated chromatographic conditions) which have the potential to challenge conformance to the ATP (e.g., small resolution value, component retention close to void). These tools are especially useful when the number of responses or factors is greater than four and an overlay of response surface contours becomes difficult to manage. A two-dimensional desirability plot for the simultaneous optimization of responses (component retention times, resolutions, and tailing factors) is presented in Figure 5, as a function of Column Temperature and Buffer pH factors.
 Zoom In
Figure 5. Numeric Optimization Interaction Plot of Desirability Presented as a Function of Column Temperature vs. Buff er pH at Optimal Method Conditions
 Zoom In
Figure 6. Graphical Optimization Interaction Plot of Initial Organic Content versus Final Organic Content under pH 5.9 Method Conditions
An example of a graphical optimization is presented in Figure 6 as a two-dimensional interaction plot of initial organic percent (y-axis) versus the final organic percent (x-axis).
In examples shown in Figures 5 and 6, the factors not presented graphically are individually iterated to determine how they affect the selected two-dimensional space. Factor combinations (chromatographic conditions) that have the highest probability of challenging conformance to the ATP can be identified through this iterative approach and further method verification exercises can be employed to establish ATP conformance and ultimately define the MODR.
Method verification
Validation of the method in line with ICH Q2(R1) guidelines is typically carried out at a set point (normal operating condition – NOC) within the chromatographic spaces evaluated. In addition to validating the method characteristics as per regulatory guidance, verifying the accuracy and precision provides additional understanding of the method’s measurement uncertainty and confirms conformance to the previously defined method performance requirements (ATP). This can be accomplished through a joint accuracy and precision assessment done at method factor points within the chromatographic separation space that present the greatest probability of challenging the method’s ability to meet the ATP.
Table 5. Robustness Verifi cation Study Results
 Zoom In
An example of the method verification approach is illustrated in the following example. A study was performed to verify method performance at three design points determined from a primary study that looked at factors related to the robustness of the separation, as well as to confirm conformance to the ATP. The verification study design is presented in the top of Table 5 along with the attributes investigated. Three sample preparations at each concentration level (70%, 100%, and 130%) were analyzed (and averaged) at each verification point for a total of twenty seven samples. The response results that are assessed against the ATP are presented at the bottom of Table 5, where the average (n=3) accuracy and precision values are listed. Factors that contribute to the overall method (accuracy and precision) variability include method repeatability components (e.g., instrument, standard and sample preparation) and intermediate precision components (e.g., method assessment over multiple days, instruments, analysts, laboratories). All of these sources of variability should be taken into account when assessing the method against the ATP (for brevity, only method repeatability components are listed in Table 5).
 Zoom In
Figure 7. ATP Probability Contour Plot for Assay Measurements
The visualization of the ATP for assay is graphically presented as the dark shaded region in Figure 7. This region represents ± 3% of the true value with a 95% probability (the combined contributions of accuracy (bias) and precision (method repeatability) are such that the true potency value of a sample is within ± 3% of the reported value with at least 95% probability). Accuracy (bias) and precision (variability) estimates residing within the shaded region establish that the method meets the requirements of the ATP. Under this combined accuracy and precision assessment, conformance to the ATP is met for methods having performance characteristics of (1) high precision and accuracy (red X), (2) high precision, but bias (blue X), (3) high accuracy but low precision (green X), but not (4) combined low precision and biased (yellow X). Barnett et al. [22] describes the ATP accuracy and precision concepts in more detail.
Table 6. Chromatographic Operable Ranges
The validation and verification experiments demonstrate that the method is robust across the parameter ranges provided in Table 6. However, in this particular method example, a method control strategy was enacted that constrained the organic modifier to 63% (rather than the verification level of 62%) and fixed the flow rate to 1.00 mL/min to ensure acceptable retention of degradation products. Operation within these limits ensures that the method meets its intended performance requirements. Similar assessments for degradation products can be made against an appropriately defined ATP for the degradation product.
Control Strategy/ Conformance to ATP
A meaningful method control strategy is established based on the wealth of data collected during the method development and verification stages described above. Using this data, correlations can be drawn between method attributes, such as resolution, and the ability to meet ATP criteria. The control strategy should also include those method parameters that influence method variability and will be fixed (e.g., reagent grade, instrument brand or type, column type). It should be noted that the method control strategy does not appear dramatically different under the AQbD approach when compared to the traditional approach. However, method controls are established based on a more extensive data set using the ATP criteria as a guide, thus ensuring a stronger link between the method purpose and method performance.
Continuous monitoring/lifecycle management
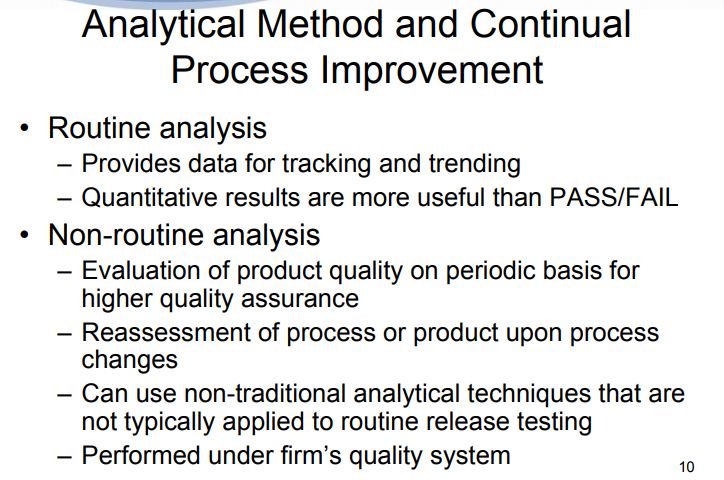
Once a method is established for routine use, method performance should be monitored over time to ensure that it remains compliant with the ATP criteria. This can be done, for example, by using control charts or other tools to track system suitability data, methodrelated investigations, etc. Periodic fit for purpose re-verification experiments can also be performed as warranted. Continuous monitoring allows the analyst to proactively identify and address any out-of-trend performance.
Existing methods should be periodically re-evaluated to address any gaps or improvement opportunities identified in the current methodology by improving the methodology, or, as analytical technologies advance, implementing a new technology.
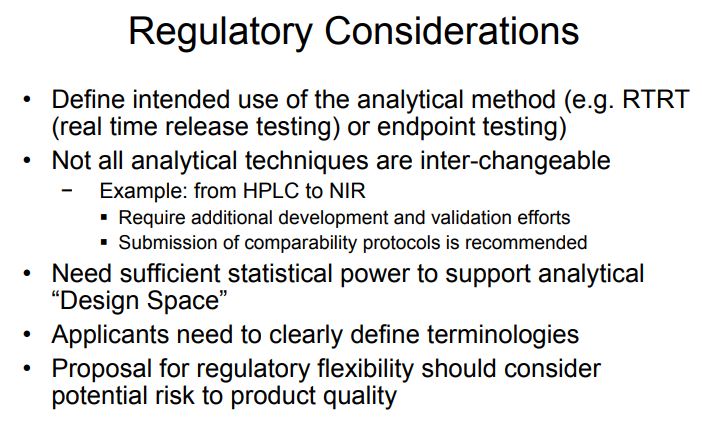
Regulatory Considerations There is presently no regulatory guidance defining application of Quality by Design concepts to analytical methods. However, since many of the concepts described here are related to good science and risk assessment, regulatory agencies such as the FDA and EMA have been open to inclusion of these concepts in regulatory filings provided the applicant follows the current regulatory guidelines. The FDA and EMA recently announced a joint collaboration that began in January 2013 [35]. The goals of the collaboration are (1) to develop analytical methods (e.g. HPLC) based on the QbD paradigm; (2) define protocols for method transfer; (3) establish methodology for verification of the MODR upon site transfer; and (4) define review criteria for evaluation of QbD-based analytical methods.
Regulatory Perspective of AQbD
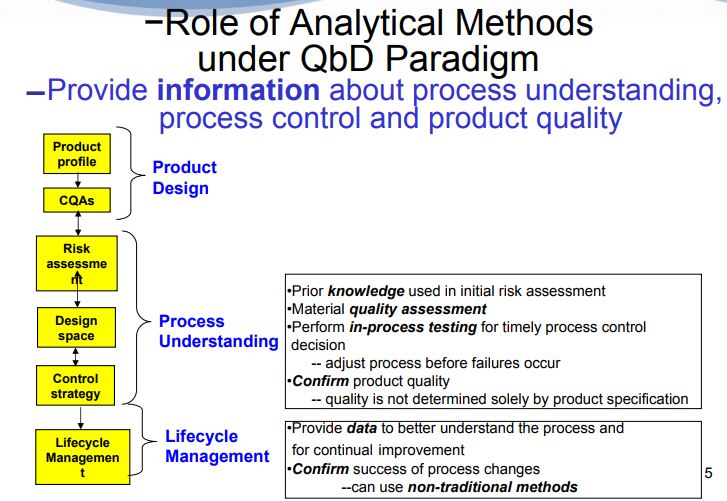
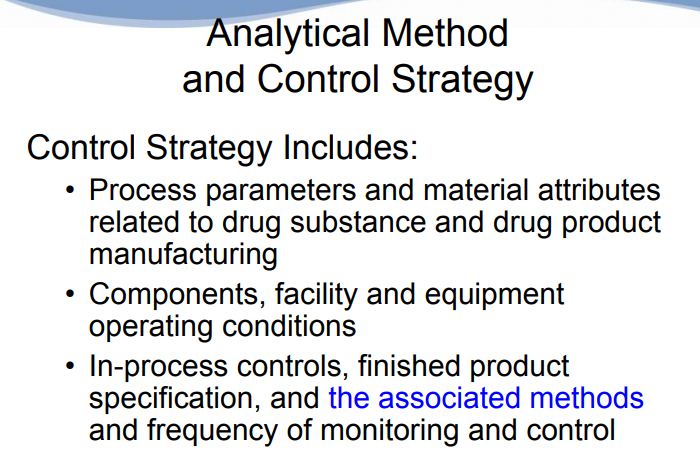
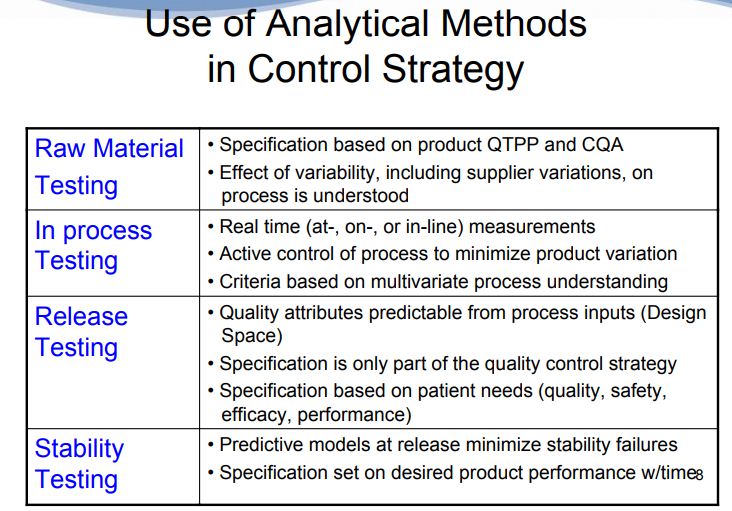
With reference to pharmaceutical quality system (ICH Q 10 guidelines), analytical methods are key part of control strategy. Thus implementation of analytical QbD in manufacturing process as control strategy will ensure predetermined performance and product quality. This includes parameters and attributes related to drug substance and drug product materials components including facility, instrument operating conditions, finished product specification, and the associated methods and frequency.
Implementation of AQbD is expected to strengthen the concept of “right analytics at right time” which plays significant role in drug product development cycle. Few months ago, FDA has approved a few new drug applications based on analytical QbD and referred the importance and benefits of QbD in analytical method development . It triggers the role of analytics in the product development cycle for understanding drug excipient interactions and for the measure of critical quality attributes (CQA) during experiment, process, control, and also continuous process verification in order to monitor trends in the product quality. So this resonance has attracted the pharmaceutical industry to evoke the concept of analytical quality by design (AQbD). Though cGMP regulations have been in place in the past one decade, the significant number of QC related warning letters issued by FDA demonstrated that companies have problems with risk management system in analytical methods and related systems. Quality assurance personnel believes that AQbD will be a better solution to avoid OOT and OOS and to reduce risk in method failure.
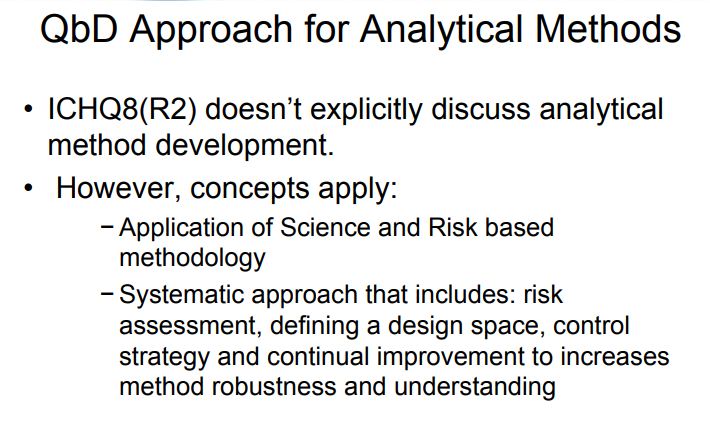
Due to the above cited discussion, analytical method development using QbD approach is a current area of focus and needs to be implemented. The process of developing and validating analytical methods parallel to product QbD benefits the quality of the product furthermore, with high degree of assurance, and it may be similarly benefitted. The dependence of pharmaceutical development and manufacture on robust analytical data intensifies the need for rigor in analytical method development and increasingly an analytical QbD (AQbD). ICH Q8 (R2) guidelines do not discuss analytical method development in correlation with design space; however it is understood that the concept can be applied to analytical design space and continuous improvement in method robustness and understanding . In fact analytical methods are the indicator of quality of process, product, and robustness throughout the life cycle.
How to Implement in the Current Practice
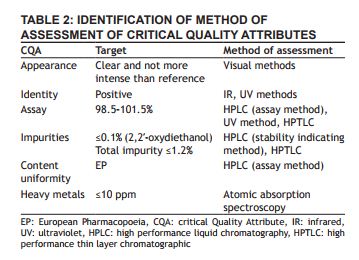
In future, analytical QbD has to be introduced in the method development phase and has to be validated for the method performance along with the validation protocol. For a given drug product, to implement analytical QbD, the following may be considered.(i)Construct a QTPP (a profile based on the product specification as outlined in FDA approval).(ii)Analyze each product specification for criticality.(iii)Assess and justify the analytical method development and its suitability to support the criticality.(iv)Select the suitable analytical method like HPLC, UV, and IR to meet ATP and then QTPP.(v)Perform risk assessment for selected method.(vi)Identify the quantitative and qualitative variable that affects the method performance and method responses to be measured.(vii)Use suitable DOE experiment to optimize variable and establish scientific understanding.(viii)Find the region, models to assess the robust, and economic operation for the method variable.(ix)Validate the models and MODR region using experimental verification at different points to prove robustness.(x)Then validate the method in the operable region for the method performance and subject to control strategy and improvement.
PAT and AQbD
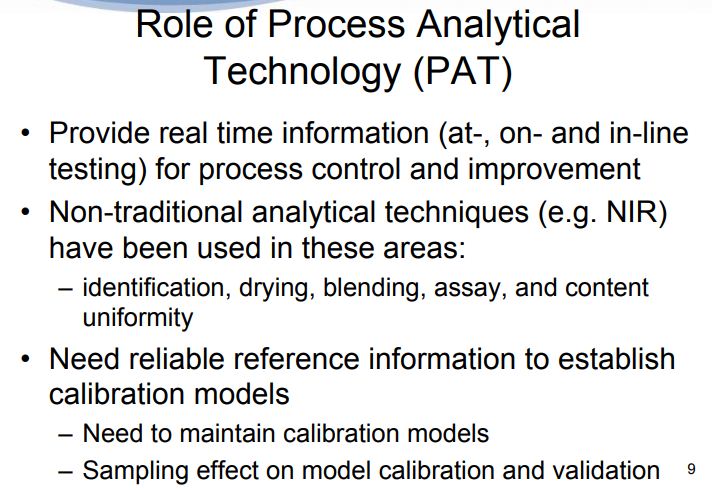
For the effective implementation of process analytical technology (PAT) system, parallel development of analytical QbD is highly recommended. PAT is based on two major components: (a) understanding of the scientific and engineering principles involved manufacturing process; (b) identification of the variables which affect product quality. According to the FDA draft guidance, “the desired state of pharmaceutical manufacturing is that product quality and performance are ensured through the design of effective and efficient manufacturing processes” in which continuous and real time quality assurance was recommended. Once the properties of the drug product components are understood, the processing variables that control the relevant properties must be identified. Identification of these variables necessarily requires a multivariate approach. Now, pharmaceutical industries are in progress of establishing specific process understanding and design process analytical control strategies to make PAT approach more effective tool
Regulatory Considerations for Current and Future
The FDA and EMA recently announced a joint collaboration that began in January 2013. The goals of the collaboration are to (1) develop analytical methods (e.g., HPLC) based on the QbD paradigm; (2) define protocols for method transfer; (3) establish methodology for verification of the MODR upon site transfer; and (4) define review criteria for evaluation of QbD based analytical methods.
Recommendations
Analytical methods for existing drugs have to be periodically reevaluated to address any gaps or any improvement in method performance, risk factors using AQbD. Range of robustness for the method needs to be proven by verification and scientific understanding in order to avoid method failure in method transfer and also to reduce OOS and OOT.
Conclusions
Quality by Design for analytical methods is well discussed in the pharmaceutical industry. The outcomes of developing methods via QbD principles include enhanced understanding of (method and instrument) risk factors that may lead to poor method robustness, and helping to ensure that the method meets its intended performance requirements throughout the (product/method) lifecycle.
References
- International Conference on Harmonization (ICH) Q8(R2): Pharmaceutical Development (August 2009).
- International Conference on Harmonization (ICH) Q11: Development and Manufacture of Drug Substances (Chemical Entities and Biotechnological/Biological Entities) (May 2011).
- Borman, P.; Nethercote, P.; Chatfield, M.; Thompson, D.; Truman K. The Application of Quality by Design to Analytical Methods. Pharm. Tech. 2007, 31(12) 142-152.
- Schweitzer, M.; Pohl, M.; Hanna-Brown, M.; Nethercote, P.; Borman, P.; Hansen, G.; Smith, K.; Larew J. Implications and Opportunities of Applying QbD Principles to Analytical Measurements. Pharm. Tech. 2010, 34 (2) 52-59.
- Vogt, F.G.; Kord A.S. Development of Quality-By-Design Analytical Methods. J. Pharm. Sci. 2011, 100(3), 797-812.
- Bhatt, D.A.; Rane, S.I. QbD Approach to Analytical RP-HPLC Method Development and its Validation. Int. J. Pharm. and Pharm. Sci. 2011, 3(1) 179-187.
- Krull, I.; Swartz, M.; Turpin, J.; Lukulay, P.H.; Verseput, R. A Quality-by-Design Methodology for Rapid LC Method Development, Part I. LCGC N. Am. 2008, 26, 1190-1197.
- Krull, I.; Swartz, M.; Turpin, J.; Lukulay, P.H.; Verseput, R. A Quality-by-Design Methodology for Rapid LC Method Development, Part II. LCGC N. Am. 2009, 27, 48-61.
- Meyer, C.; Soldo, T.; Kettenring, U. Highlights of Analytical Chemistry in Switzerland. Chimia 2010, 64(11), 825.
- Graul, T.W.; Barnett, K.L.; Bale, S.J.; Gill, I; Hanna-Brown M. in Chemical Engineers in the Pharmaceutical Industry: R&D to Manufacturing; am Ende, D.J. Ed.; John Wiley & Sons: New York, 2011, pp 545-562.
- Ling S.; McBrien, M. A Quality by Design Approach to Chromatographic Method Development. LCGC: The Column 2011, 7(5), 16-20.
- Molnar, I.; Rieger, H.-J.; Monks, K.E. Aspects of the “Design Space” in high pressure liquid chromatography method development. J. Chromatogr. A 2010, 1217, 3193-3200.
- Karmarkar, S.; Garber, R.; Genchanok, Y.; George, S.; Yang, X.; Hammond, R. Quality by Design (QbD) Based Development of a Stability Indicating HPLC Method for Drug and Impurities. J. Chromatogr. Sci. 2011, 49, 439-446.
- Monks, K.E.; Rieger, H.-J.; Molnar, I. Expanding the term “Design Space” in high performance liquid chromatography (I). J. Pharm. Biomed. Anal. 2011, 56 (5), 874-879.
- Reid, G.L; Cheng, G; Fortin, D.T; Harwood, J.H.; Morgado, J.E.; Wang, J.; Xue, G. Reversed- Phase Liquid Chromatographic Method Development in an Analytical Quality by Design Framework, J. of Liq. Chromatogr. Relat. Tech., 2013, DOI:10.1080/10826076.2013.765457.
- Monks, K.; Molnar, I.; Rieger, H.-J.; Bogati, B.; Szabo, E. Quality by Design: Multidimensional exploration of the design space in high performance liquid chromatography method development for better robustness before validation. J. Chromatogr. A 2012, 1232, 218-230.
- Orlandini, S.; Pinzauti S.; Furlanetto S. Application of quality by design to the development of analytical separation methods, Anal Bioanal Chem. 2013, 405, 443–450
- Musters, J.; van den Bos, L.; Kellenbach, E. Applying QbD Principles To Develop a Generic UHPLC Method Which Facilitates Continual Improvement and Innovation Throughout the Product Lifecycle for a Commercial API. Org. Process Res. Dev. 2013, 17, 87−96.
- Rozet, E.; Lebrun, P.; Debrus, B.; Boulanger, B.; Hubert P. Design Spaces for analytical Methods. Trends in Analytical Chemistry, 2013, 42, 157-167.
- Kochling, J.; Bridgewater, J.; Naji R. in Pharmaceutical Stability Testing to Support Global Markets; Huynh-Ba, K. Ed.; Springer: New York, 2010, pp 169-179.
- Cecil, Todd; Acceptable Analytical Method Variation – Setting System Suitability Requirements, Pittcon 2013
- Barnett, K.L.; Harrington, B.;. Graul, T.W. in Liquid Chromatography Applications; Fanali, S.; Haddad, P.R.; Poole, C.F. Eds; Elsevier, 2013, pp 57–73.
- Huberta, Ph.; Nguyen-Huub, J.-J.; Boulangerc, B.; Chapuzetd, E.; Chiapa, P.; Cohene, N.; Compagnonf, P.-A.; Dew´ec, W.; Feinbergg, M.; Lallierh, M.; Laurentiei, M.; Mercierd, N.; Muzardj, G.; Nivetk, C.; Valatl, L. Harmonization of strategies for the validation of quantitative analytical procedures A SFSTP proposal—part I. J. Pharm. Biomed. Anal. 2004, 36, 579–586.
- Ahuja, S. and Jespersen, N. Modern Instrumental Analysis, Elsevier, Amsterdam, 2006.
- Skoog, D.A., Holler, F.J, Crouch, S.R. Principles of Instrumental Analysis, Thomson Learning, 2006.
- Ahuja, S.; Scypinski, S. Handbook of Modern Pharmaceutical Analysis, Second Edition, Academic Press, 2011.
- Nickerson, B. Sample Preparation of Pharmaceutical Dosage Forms, Springer, 2011.
- Ahuja, S.; Dong, M. Handbook of Pharmaceutical Analysis by HPLC, Elsevier, 2005.
- Sasic, S.; Ozaki, Y. Raman, Infrared, and Near-Infrared Chemical Imaging, John Wiley & Sons, 2011.
- Burns, D.A.; Ciurczak, E.W. Handbook of Near-Infrared Analysis, Third Edition, CRC Press, 2007.
- Wawer, I.; Diehl B. NMR Spectroscopy in Pharmaceutical Analysis, Elsevier, 2011.
- Reid, G.L., Ward, H., Palm, A.S., Muteki, K. Process Analytical Technology (PAT) in Pharmaceutical Development, Amer. Pharm. Rev. 2012, 15(4), 49-55.
- International Conference on Harmonization (ICH) Q9: Quality Risk Management (November 2005).
- Myers, R.H; Montgomery, D.C. Response Surface Methodology: Process and Product Optimization using Designed Experiments, Second Edition, New York: John Wiley & Sons, 1995.
- QbD Considerations for Analytical Methods – FDA Perspective, presented at the IFPAC Annual Meeting, Baltimore, January 25, 2013, Sharmista Chatterjee, Ph.D., CMC Lead for QbD ONDQA/CDER/FDA.
- https://www.hindawi.com/journals/ijac/2015/868727/
///////////
“ALL FOR DRUGS” CATERS TO EDUCATION GLOBALLY, No commercial exploits are done or advertisements added by me. This is a compilation for educational purposes only. P.S. : The views expressed are my personal and in no-way suggest the views of the professional body or the company that I represent
50,989 total views, 2 views today


